Silver Price Prediction: Can Today's US GDP Data Spark XAG Breakout?


A loaded US data day is about to test the metal, and the chart has been building tension for a week.
This silver price prediction walks through where XAGUSD trades now, which levels carry the weight, and how the 6:00 PM IST releases could move it.
It is a chart and data read from the editorial desk, not a personal position and not advice.
Silver Price Today: XAGUSD Live Price Data and Market Snapshot
Silver trades at $60.871 per ounce on the 1-hour FOREX.com XAGUSD chart. We treat this print as the CMP, or current market price.
The chart shows a sell quote of $60.851 and a buy quote of $60.891. The latest 1-hour candle opened at $61.040, ranged between $60.789 and $61.203, and closed down $0.169, or 0.28%.
The RSI, a momentum oscillator, reads 43.53. It has flashed several bullish divergence signals over the past week, meaning price kept making lower lows while momentum held up better than price did.
Source: TradingView and FOREX.com, Sep 30, 2026, 3:16 PM IST.
Silver News Today: US GDP and PCE Data Could Spark a Breakout
The economic calendar shows a dense US block this evening, with all times in IST.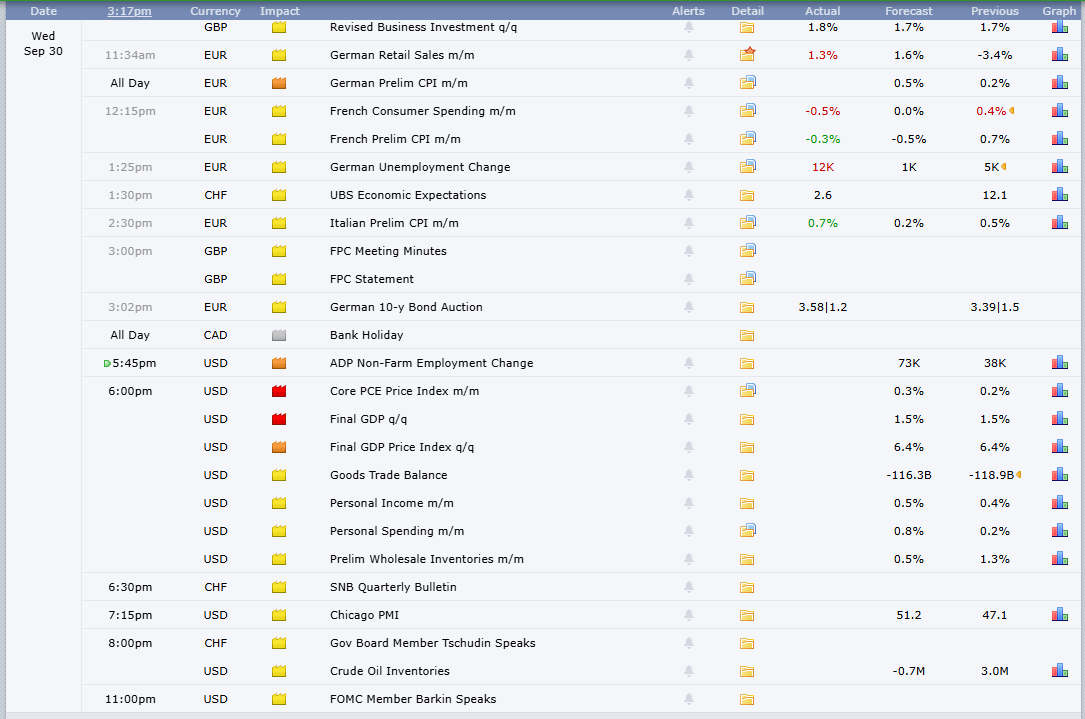
ADP Non-Farm Employment Change lands at 5:45 PM with a forecast of 73K against 38K previously.
At 6:00 PM comes the heavyweight group: Core PCE Price Index m/m (forecast 0.3%, previous 0.2%) and Final GDP q/q (forecast 1.5%, previous 1.5%), both flagged high impact.
The final GDP price index q/q is forecast at 6.4%, matching the last reading. Personal income is forecast at 0.5% and personal spending at 0.8%.
Chicago PMI follows at 7:15 PM, forecast 51.2 against 47.1, and FOMC member Barkin speaks at 11:00 PM.
Core PCE is the inflation gauge the Fed watches most closely, and Final GDP is the third estimate of quarterly growth.
Stronger US data tends to lift the dollar and yields, which can weigh on the metal, while softer data often does the opposite. Because the GDP forecast matches the previous print, the surprise matters more than the headline number.
Source: Forex economic calendar, Sep 30, 2026.
XAGUSD Price Target Quick Take: Key Silver Breakout Levels Today
Price sits at $60.871, hovering near its support zone after a lower low beneath the descending trendline.
A 1-hour close above $63.045 opens at $65.090, then $67.565.
A close below $59.432 points to $58.030 as the next support.
RSI reads 43.53 after several bullish divergence flags, so momentum is holding up better than price.
The 6:00 PM IST US data block is the near-term trigger, and neither side is confirmed yet.
XAGUSD Technical Analysis: Trendline Rejection and Support Zone
Methodology: 1-hour timeframe, FOREX.com XAGUSD chart, RSI oscillator, invalidation on a 1-hour close below $59.432.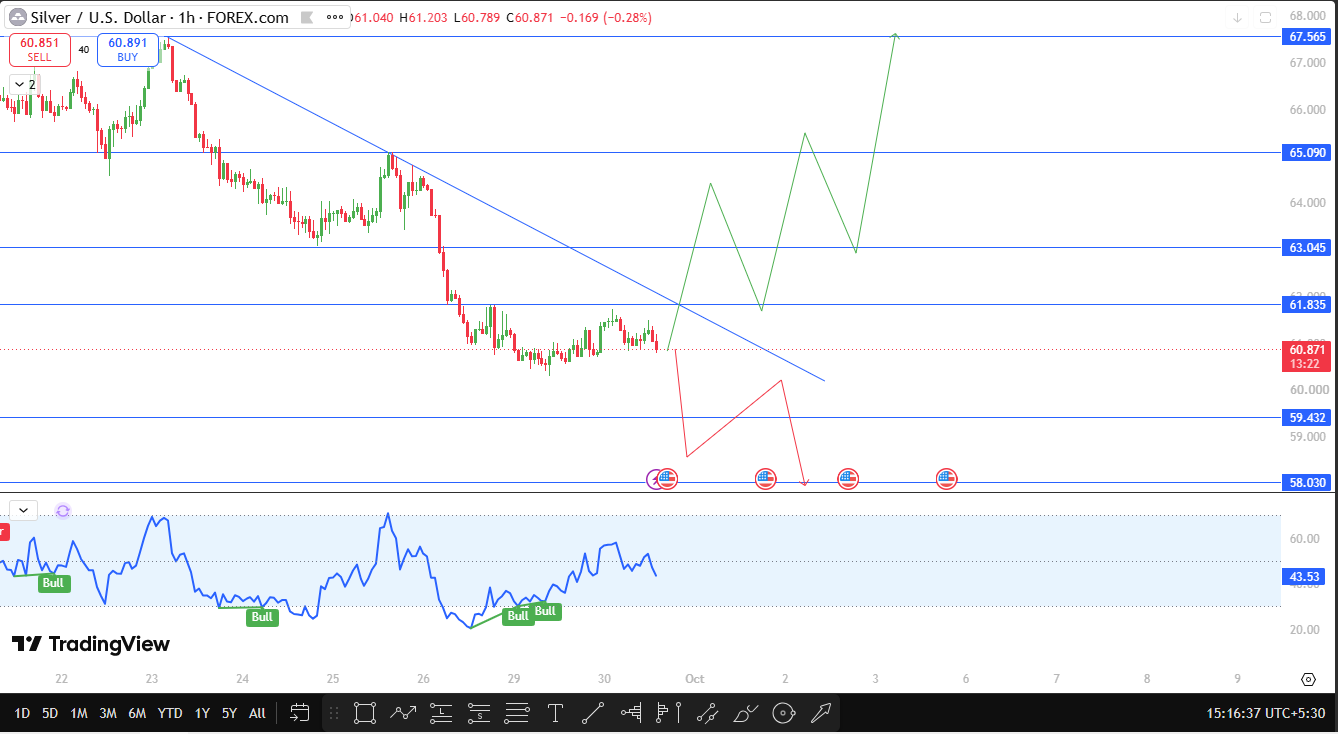
This silver technical analysis starts with the descending trendline. Price rejected the line on the first retest, made a lower low, and slid toward the $60 area, where it has been holding in a tight range since.
Sellers drove the drop, but the lack of follow-through near support suggests they are running out of steam. The $61.835 level, the top of the current range, sits between price and the trendline, so it is the first hurdle for buyers.
If buyers break the trendline and a 1-hour close lands above $63.045, silver breakout targets open at $65.090 and then $67.565.
If support gives way and a close lands below $59.432, the next stop is $58.030. Our XAGUSD price prediction stays neutral until one of those closes prints.
Our silver trend analysis stays bearish-leaning while price remains under the descending line.
Source: TradingView, Sep 30, 2026, 3:16 PM IST.
Silver Support and Resistance: XAGUSD Breakout Price Targets
Level | Type | Price | Distance from CMP |
Major resistance 2 | Resistance | $67.565 | +11.00% |
Major resistance 1 | Resistance | $65.090 | +6.93% |
Breakout trigger | Resistance | $63.045 | +3.57% |
Range top | Minor resistance | $61.835 | +1.58% |
CMP | Current price | $60.871 | 0.00% |
Breakdown trigger | Support | $59.432 | -2.36% |
Major support | Support | $58.030 | -4.67% |
Silver Price Forecast: Bull, Base, and Bear XAGUSD Scenarios
Bull case. A 1-hour close above $63.045 (+3.57%) would clear the range top and the descending trendline together. That opens $65.090 (+6.93%) and then $67.565 (+11.00%), and a strong GDP or PCE surprise in the right direction could provide the push.
Base case. Price keeps grinding between $59.432 and $63.045, with small candles and false pushes around the data releases. Traders waiting for confirmation simply stay flat.
Bear case. A 1-hour close below $59.432 (-2.36%) breaks the support zone and sends the price toward $58.030 (-4.67%). The trendline rejection and lower lows show sellers still hold the bigger trend.
Silver Price Outlook Risks: What Could Break This XAGUSD Setup
Data day volatility is the biggest one. The 5:45 PM and 6:00 PM IST releases can whip prices in both directions within minutes, and spreads often widen around them.
On a 1-hour chart, wicks can tag a level without closing beyond it, which is why this read waits for closes. Barkin's speech at 11:00 PM adds late headline risk. And a sharp dollar move can override any single chart pattern.
Commodity Price Prediction Disclaimer and Forecast Risk Notice
This article is for information only and is not financial advice. Commodity and forex markets are volatile, and you can lose your entire investment. Always do your own research and consult a licensed advisor before trading.











.webp)










