Crude Oil Price Prediction October 2026: Can Oil Hit $100 on Iran War?


Crude oil price prediction October 2026 searches are rising as WTI slips back toward a key trendline.
The oil price is trading near $92.19 per barrel, down 1.19% on the day, after a bounce earlier in the session faded.
In the crude oil price today data, $WTI is now sitting at the rising boundary of a symmetrical triangle on the 4-hour chart.
This crude oil price forecast looks at the latest news, market data, and chart levels to map the next likely move.
Live WTI Crude Oil Market Data
Metric | Value |
WTI Crude Oil Price | $92.19 per barrel |
Daily Change | -$1.11 (-1.19%) |
Brent Crude (Nov Futures) | $106.99 |
Brent Crude (Dec Futures) | $99.51 |
WTI Level at 06:26 GMT | $94.00 |
Source: WTI price data taken from TradingView (TVC), as of Sep 29, 2026, 15:15 GMT+5:30. Brent and early WTI figures taken from a report shared by The Cradle on X. Figures may vary slightly across other tracking websites.
Crude Oil News Today: Supply Worries Keep Prices Elevated
The latest crude oil news today comes from a report shared by The Cradle on X. According to the report, oil prices rose for a second straight session on Tuesday.
Traders were focused on possible supply disruptions in West Asia linked to the US-Israeli war on Iran, and those concerns outweighed signs that crude exports from the region were recovering.
At 06:26 GMT, November Brent futures gained $1.71, or 1.6%, to $106.99 per barrel.
The more actively traded December Brent contract rose $1.68 to $99.51, and US West Texas Intermediate gained $1.40, or 1.5%, to $94.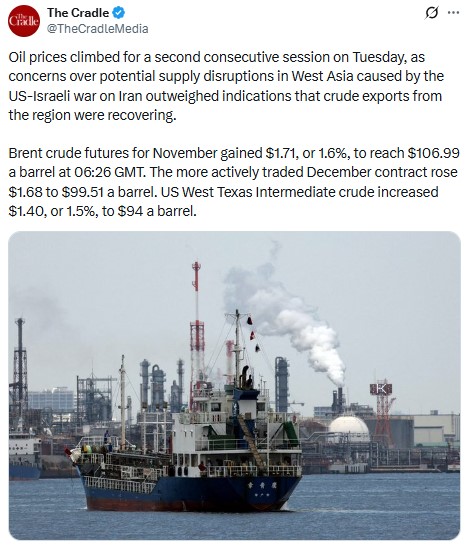
Source: Data taken from @TheCradleMedia, X Account, as of Sep 29, 2026
The oil news today shows that geopolitics is still the main driver behind the oil price.
Headlines on supply routes can move crude sharply in either direction, so traders often combine news with chart levels.
Note that WTI has since given back its early gains and now trades below $93, which shows that buyers are not fully confident yet.
Crude Oil Technical Analysis
This crude oil technical analysis starts with the pattern squeezing price right now.
On the 4-hour chart, $WTI is trading inside a symmetrical triangle. This pattern forms when a falling trendline from above and a rising trendline from below meet at a point.
Price fell sharply from the highs earlier this month, found a low near $88.67 around September 22-23, and has been making lower highs and higher lows since. $WTI is now trading around $92.16, right on the rising trendline.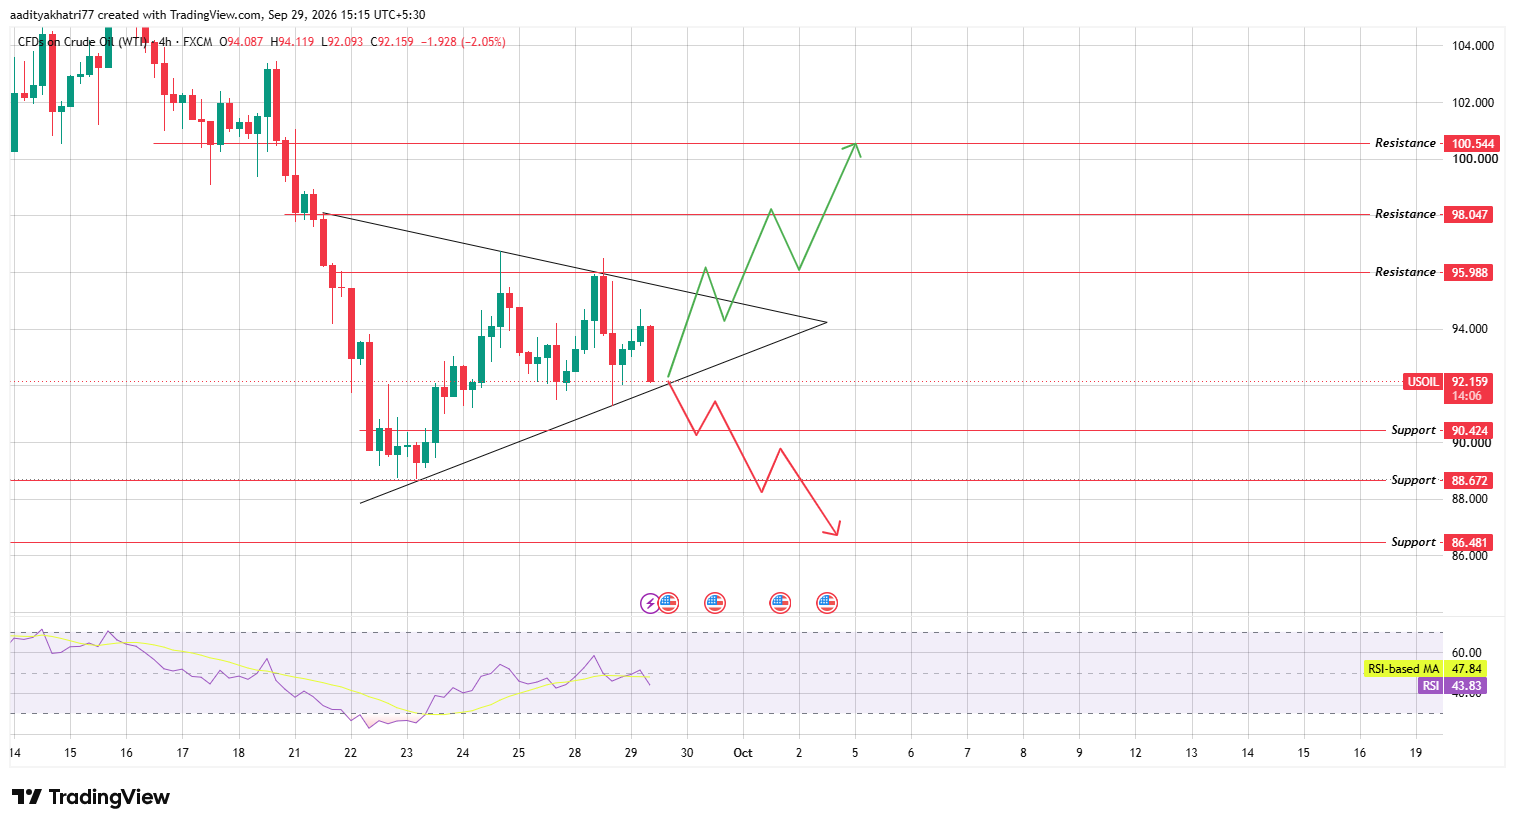
Source: Chart taken from TradingView, as of Sep 29, 2026
RSI reads 43.83, below its moving average of 47.84 and below the 50 midline.
Momentum currently leans toward sellers, and the rejection from the falling trendline near $95 supports that view.
The triangle is also close to its apex in early October, so a decisive breakout is likely soon.
Can WTI Push Toward Higher Resistance?
The bullish setup needs to happen in steps. First, WTI has to bounce from the rising trendline of the triangle.
Next, it needs a 4-hour close above the falling trendline, and then it has to clear the $95.988 resistance.
If that happens, the first upside target is $98.047. A stronger move can extend toward $100.544, which is the major resistance on the chart.
A breakout is more reliable when it comes with a strong candle close and rising volume. A move above the line without follow-through can easily fall back inside the triangle.
What Happens If WTI Breaks the Rising Trendline?
The bearish setup works the other way. If WTI breaks the rising trendline of the triangle and then loses the $90.424 support, sellers can take control.
In that case, the next downside target is $88.672, which is also the recent swing low. If that level also fails, $86.481 becomes the next major support zone.
Breakdowns from triangles can move fast once support gives way. With the RSI already below its average, this is the risk to keep in mind.
Crude Oil Price Levels to Watch
Support | Resistance |
$90.424 | $95.988 |
$88.672 | $98.047 |
$86.481 | $100.544 |
Bull, Base, and Bear Scenarios
Scenario | Setup | Level |
Bull | Bounce, falling trendline, and resistance break | $98.047 to $100.544 |
Base | Triangle holds, range trade | $90.424 to $95.988 |
Bear | Rising trendline and support break | $88.672 to $86.481 |
What Is Driving the Oil Price Now?
Supply news is the main driver right now. Any report of disruption in West Asia tends to lift crude quickly, while signs of recovering exports can pull it lower.
Traders also watch the US dollar and global growth data, because a stronger dollar or weaker demand outlook usually puts pressure on oil.
With price this close to a key trendline, a single headline can decide which side of the triangle breaks first.
Methodology
This crude oil price prediction was built from a 4-hour WTI (USOIL) chart on TradingView. The triangle boundaries, RSI, and RSI-based moving average were checked candle by candle.
Support and resistance levels came directly from the marked price zones on that chart. The live price came from a TradingView snapshot, and the news and Brent figures came from a post on X, both taken the same day.
Nothing here substitutes for independent research. A chart pattern only describes probability, not certainty.
Expert Opinion
Based on the chart and the news flow, the setup for October is balanced but leans cautious in the short term.
The triangle is still intact, geopolitical supply worries support prices, and the market has not broken below the rising trendline yet.
At the same time, RSI is below its average, and the recent bounce has faded from $94. A rebound means little if WTI cannot clear $95.988 with a strong close, while a break below $90.424 would shift the bias to sellers.
Disclaimer: This article is for informational purposes only and does not constitute financial advice. Commodity markets, including crude oil, carry high volatility and downside risk; prices can move sharply against any projected level, and past performance offers no guarantee of future results. Readers should conduct independent research before making any investment decision.








.webp)













