Dogecoin Price Prediction: $DOGE Could Shock Traders With a Breakout


Back on May 8, 2021, Dogecoin touched $0.7376.
Elon Musk's tweets, an SNL appearance, and retail traders piling in by the millions that was the moment. Today it's a different story. $DOGE sits near $0.0690, over 90% off that high. So in this dogecoin price prediction, show where it goes from here.
Right now the price is pinned at a decision point. Neither side has blinked yet. If buyers show up with real volume, a recovery leg starts to look possible.
If they don't, expect more sideways grinding before DOGE makes any serious run at its old highs. Nobody's calling a return to $0.73 anytime soon, but the next few candles matter more than usual.
Live Market Data
$DOGE is currently trading at $0.0690. Down 0.8% over 24 hours. That's where $DOGE stands right now, having ranged between $0.06832 and $0.07006 in the past day. 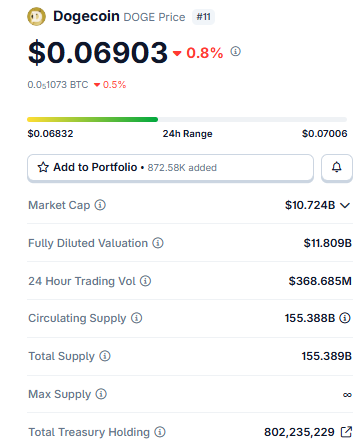
Source: $DOGE Market Cap Data Taken From Coingecko, data as of Aug 07, 2026. Figures may vary slightly across other tracking websites.
Market cap works out to $10.724B, and the fully diluted valuation isn't far off at $11.809B, because circulating supply (155.388B) and total supply (155.389B) are basically the same number at this point.
Trading volume over the last 24 hours came in at $368.685M.
One thing worth noting: with supply already almost entirely in circulation, dilution just isn't a factor traders need to worry about here.
Liquidation Data
The liquidation heatmap tells an interesting story here.
Zoom out to 24 hours, and $2.46M got liquidated in total, with $1.89M of that on the long side. Leveraged bulls clearly got caught leaning the wrong way during the recent dip.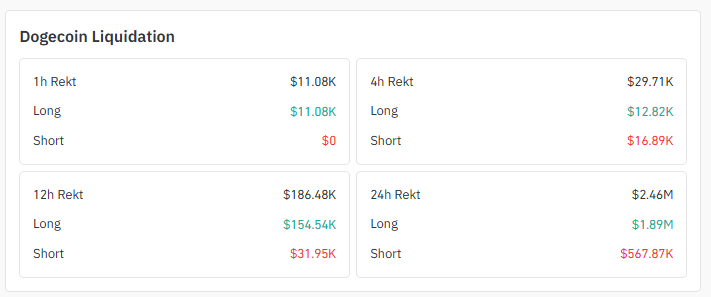
Source: Liquidation Data Taken From Coinglass.
But zoom in and the picture flips. Over the last 4 hours, shorts lost $16.89K versus $12.82K for longs.
In just the past hour, every dollar liquidated, all $11.08K of it, came from longs. Small numbers, sure, but the direction matters.
Short sellers are starting to feel some heat too, which hints that buyers are quietly defending that triangle floor rather than letting it break clean.
Exchange Volume
Where's the exchange volume actually coming from? Binance, mostly, with $17.13M changing hands there in the last 24 hours. 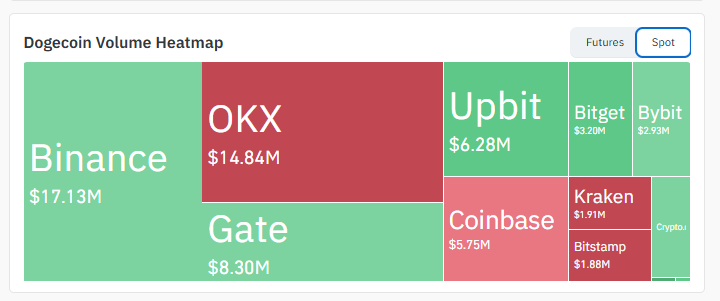
Source: Volume Heatmap Data Taken From Coinglass.
OKX follows at $14.84M, Gate at $8.30M, and Upbit at $6.28M. Coinbase, Bitget, Bybit, Kraken, and Bitstamp fill out the rest, each contributing somewhere between $1.88M and $5.75M.
Spread this wide across both US and Asian exchanges; demand isn't concentrated. in one corner of the globe, and that usually makes for a cleaner move once this triangle finally resolves.
$DOGE News Sentiment Today
Chatter on social media has been leaning bullish lately.
One widely circulated post claims whale wallets scooped up close to 1.7 billion $DOGE in a single day, roughly $119 million at current prices. 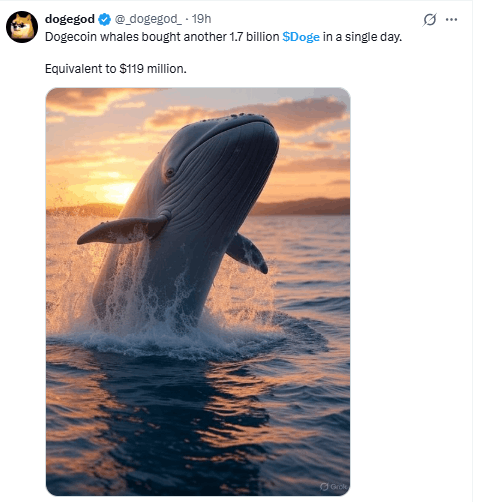
Source: Data Taken From @dogegod, X Account.
Take it with the usual grain of salt, but if it holds up, that kind of accumulation right as price coils into a tight range adds real weight behind the case for an eventual bullish breakout. Timing is still anyone's guess.
Key Takeaways
-
DOGE sits near $0.0690, down 0.8% on the day. The chart on the 4H timeframe is squeezing tighter by the hour.
-
Clear the upper trendline of the descending triangle, and $0.0738 comes into view first, then $0.0771.
-
Lose the flat base underneath, and $0.0661 is next, with $0.0632 lurking below that.
-
Whale wallets added roughly 1.7 billion DOGE in a single day. Around $119 million worth.
-
Longs bore the brunt of 24-hour liquidations at $1.89M. Shorts got off lighter at $567.87K.
4H Chart Analysis
Look at the 4H chart, and the setup is textbook.
$DOGE is boxed inside a descending triangle, a falling trendline grinding down against a flat support zone parked near $0.0685. 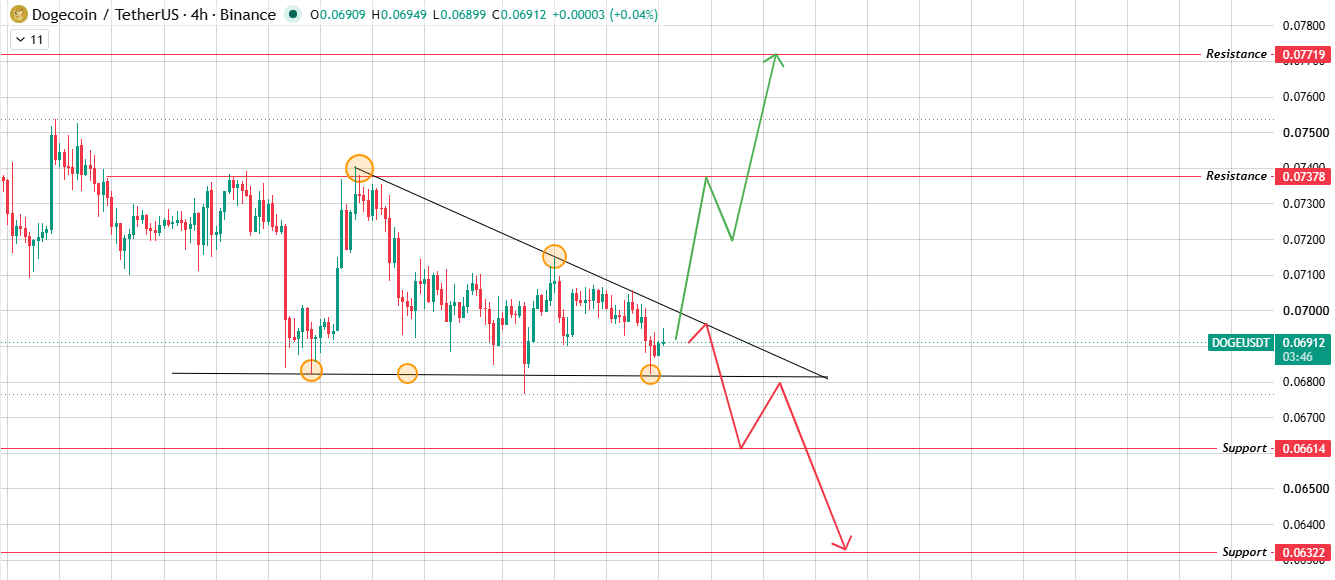
Source: Chart Taken From TradingView .
Price has poked at that floor more than once without cracking it, while the ceiling keeps creeping lower with every failed push-up. Something has to give.
Clear the descending trendline, especially with a close above $0.07378, and that's a real bullish breakout signal, buyers reasserting control with room to run toward $0.07719.
Fail to hold the base instead, and a bearish breakdown puts $0.06614 on the table fast, with $0.06322 as the harder floor if sellers really pile on.
Bull, Base, and Bear Scenarios
| Scenario | Trigger | Level 1 | Level 2 |
|---|---|---|---|
| Bull | Break above the descending trendline with volume. | $0.0738 | $0.0772 |
| Base | Price stays range-bound inside the triangle. | $0.0685-$0.0700 | Sideways chop |
| Bear | Break below the triangle support. | $0.0661 | $0.0632 |
Supply and Treasury Snapshot
An unlimited max supply usually sets off alarm bells about dilution.
Not so much here. With 155.388B already circulating out of a 155.389B total, there's barely anything left to unlock.
Treasury wallets are holding over 802 million DOGE, a chunk of centralized supply worth keeping an eye on, though nothing in the current data points to any large outflows brewing.
Risks
Zoom out and DOGE doesn't trade in a vacuum.
A shift in BTC dominance or a sudden change in ETH correlation could yank the price around regardless of what the triangle says.
Worth remembering before betting the farm on any single chart pattern. False breakouts happen more often than traders like to admit, and a move on thin volume, in either direction, isn't one to chase.
Glossary
Descending Triangle: A chart pattern formed by a falling resistance line and a flat support line, often signaling an upcoming breakout in either direction.
Liquidation Heatmap: A visual or data summary showing where leveraged long and short positions were forcibly closed due to price movement.
Support Zone: A price area where buying interest has historically been strong enough to halt or reverse a decline.
Resistance Level: A price area where selling pressure has historically been strong enough to cap further gains.
Disclaimer: This article is for informational purposes only and does not constitute financial advice. Cryptocurrency markets are highly volatile and speculative. Estimated probabilities reflect technical analysis of chart patterns, not certainty. Always conduct independent research and consult a licensed financial advisor before making investment decisions.