Dogecoin Price Prediction: DOGE Bulls Prepare for the Biggest Breakout


Which way does DOGE break? That's really what this dogecoin price prediction comes down to.
Price is squeezed between two shrinking patterns on the daily and hourly charts, sitting right at the edge of both.
Push higher, and the midzone comes into view. Fail the bounce, and it's back toward the lower zone. As of now, neither side has won yet.
Dogecoin Live Market Data
$DOGE is currently trading around $0.06969, off 0.7% on the day.
Market cap sits near $10.827 billion. 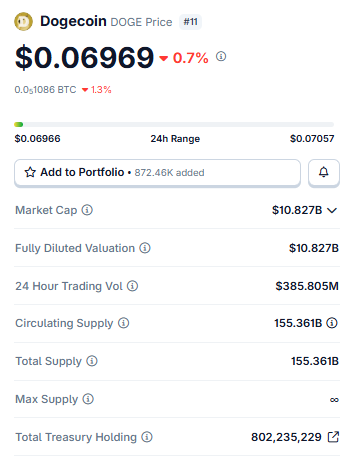
Source: $DOGE Market Cap Data Taken From Coingecko, data as of Aug 05, 2026. Figures may vary slightly across other tracking websites.
Fully diluted valuation matches that number, since there's no supply cap. 24-hour volume: $385.8 million. Circulating supply: 155.36 billion coins.
Liquidation Data of $DOGE
The liquidation heatmap tells a lopsided story right now. About $250.49K wiped out in 24 hours, and longs took $211.30K of that hit against just $39.19K for shorts.
Same story on the shorter windows; both the 1-hour and 4-hour readings skew hard toward long liquidations.
Source: Liquidation Data Taken From Coinglass.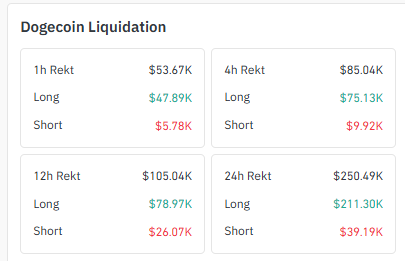
Leveraged buyers keep getting squeezed. That tracks with the price struggling to hold either boundary discussed above.
Exchange Volume Data of $DOGE
Exchange volume for DOGE isn't spread evenly. Binance dominates with $201.83 million over 24 hours. OKX follows at $140.03 million.
Then MEXC, WhiteBIT, and Bybit each landed between $49 million and $64 million.
Source: Volume Heatmap Data Taken From Coinglass.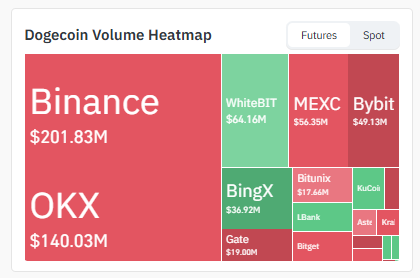
Two venues carrying most of the flow means large orders on either one can shove the price around faster than usual.
Dogecoin News Today:
One widely followed on-chain analyst flagged the recent jump in weekly active $DOGE addresses as a sign the network is "waking up," pointing to the 16% rise in active wallets as an early signal worth watching, even with the price still consolidating. 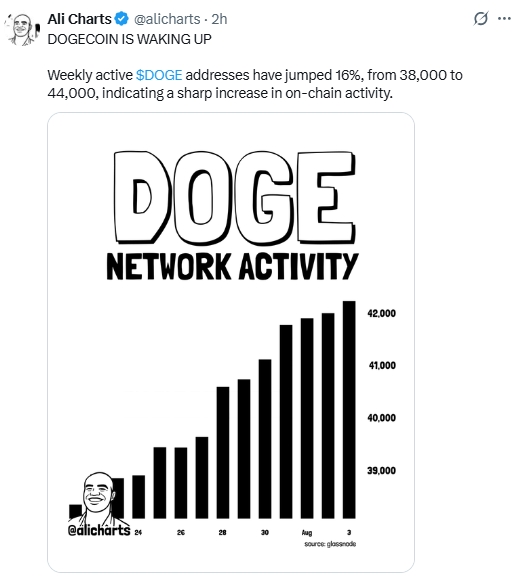
Source: Data Taken From @alicharts , X Account.
The climb wasn't a single spike either.
It built steadily through late July into early August, going from around 38,000 addresses to 44,000 over the span of a week.
That steady grind usually reads as healthier than a one-off surge, since it points to interest that's sticking around rather than fading fast.
For anyone following this dogecoin price prediction closely, rising participation against a chart that hasn't picked a direction yet is a combination worth keeping on the radar.
Key Takeaways
-
DOGE trades near $0.0697, pinned against the lower boundary of a descending channel on the daily chart.
-
The hourly chart? A tightening symmetrical triangle, with the price sitting right at the lower edge.
-
Break above $0.07938, and the door opens toward $0.08373.
-
Lose the channel floor, and DOGE could see $0.06586, then $0.06150.
-
Longs have taken the brunt of recent liquidations. Sellers are in control for now, even with network activity ticking up.
Hourly Chart: Symmetrical Triangle
Zoom into the 1H chart , and there's a symmetrical triangle forming, with the price sitting right on its lower boundary. Decision time. 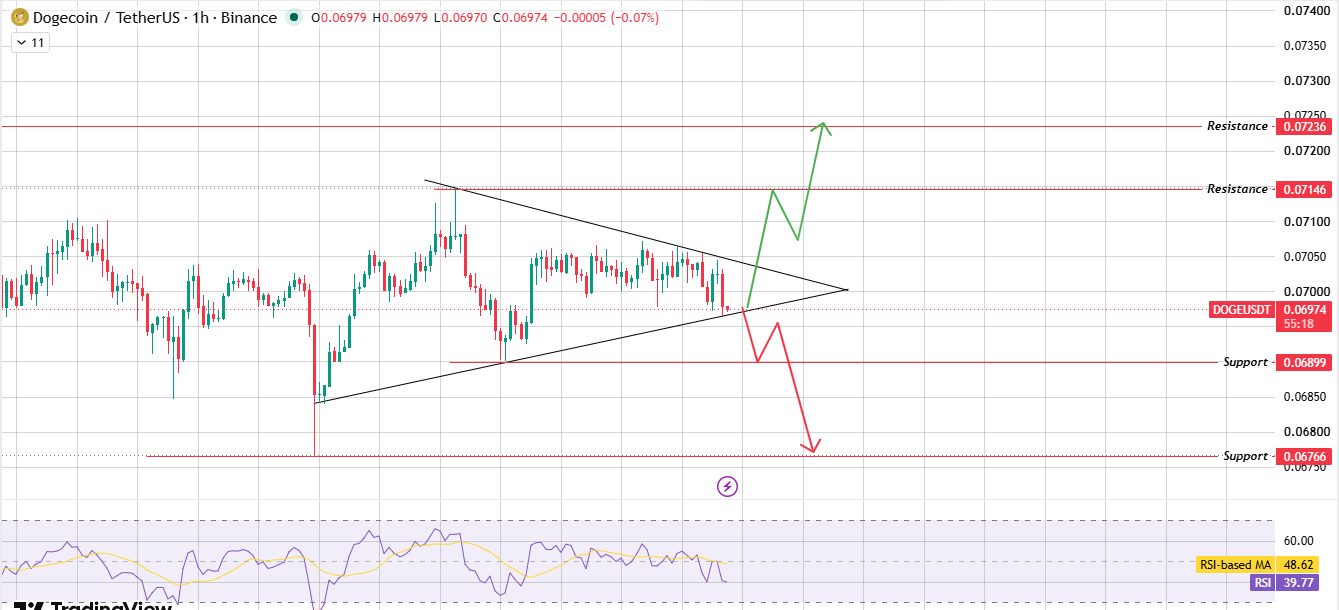
Source: Chart Taken From TradingView.
Break down from here, and $0.06899 becomes the first stop, with $0.06766 possible if sellers keep pushing.
But if buyers step in and defend this boundary, then clear the upper trendline of the triangle, $0.07146 opens up first and $0.07236 after that, assuming momentum sticks around.
Daily Chart: Descending Channel
$DOGE has been grinding lower inside a descending channel on the 1D timeframe for weeks now. Price is going to test the lower boundary as we speak.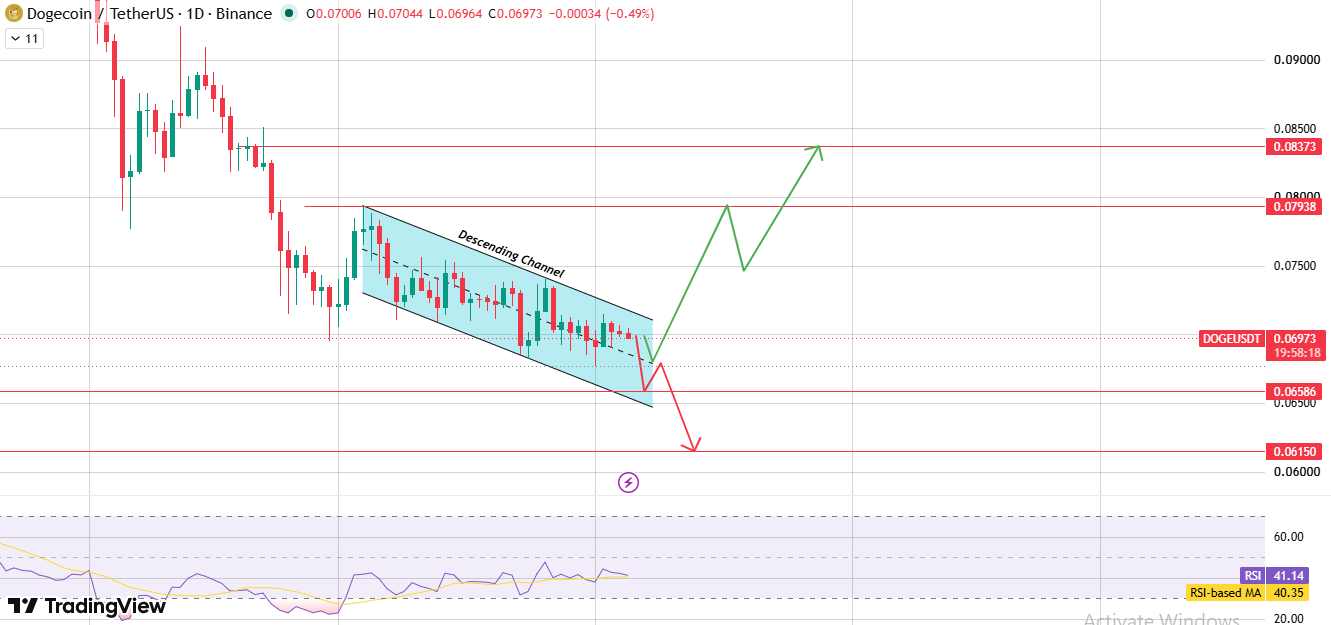
Source: Chart Taken From TradingView.
Here's the bullish path: volume shows up, price clears the channel's upper boundary, and a bullish breakout takes DOGE toward $0.07938. Hold that, and $0.08373 comes next. Not a small move, but not out of reach either.
Here's the flip side. Buyers fail near the upper boundary, the price gets rejected, and it rolls back down through the channel.
That's a bearish breakdown waiting to happen, and it points straight at the support zone around $0.06586. Below that, $0.06150 is the next stop.
Bull, Base, and Bear Scenarios
Market Context
Meme coins move with the crowd's appetite for risk, and DOGE is no exception.
BTC dominance climbing usually means capital rotating out of smaller coins.
Add in DOGE's ETH correlation, and broader altcoin weakness can drag it down too. Both are worth checking before betting on any one direction here.
Glossary
Descending Channel: Two parallel trendlines sloping downward, boxing the price in between. Keeps pointing lower until one of the boundaries finally gives.
Symmetrical Triangle: Resistance sliding down, support climbing up, squeezing price into a tighter and tighter range. Usually ends in a sharp move once it runs out of room.
Liquidation: What happens when a leveraged trade gets forced shut because losses at through the required margin. Not by choice.
BTC Dominance: Bitcoin's slice of the total crypto market cap. Rising dominance often means money leaving smaller coins for BTC.
Methodology: This analysis is based on technical chart patterns read from TradingView, along with liquidation and exchange volume data sourced from Coinglass, all as of the time of writing. Price levels are derived directly from the charts referenced, with no extrapolation beyond what the structures show.
Disclaimer: This dogecoin price prediction is for informational purposes only and does not constitute financial advice. Cryptocurrency markets, especially meme coins, are highly volatile and speculative. Always conduct independent research and consider your own risk tolerance before making any investment decisions.


















