Official Trump Price Prediction 2027: Coiled Tight and Ready to Snap?


Official Trump (TRUMP) has cooled off a lot since its early days, and the charts right now look like they're holding their breath.
There's growing chatter around the Official Trump price prediction 2027, and looking at the structure forming across timeframes, it's easy to see why.
Price is squeezed into a shrinking range, longs have been getting hit hard in recent liquidations, and the daily chart is drawing out a pattern that traders watch closely for a reason. Let's get into what's actually happening on the charts.
Liquidation Data: Longs Are Taking the Heat
The liquidation numbers over the last day paint a pretty clear picture, and it's not a great one for the bulls in the short term.
Over the past 24 hours, long positions have absorbed the vast majority of the damage compared to shorts, and that pattern holds across the shorter windows too. 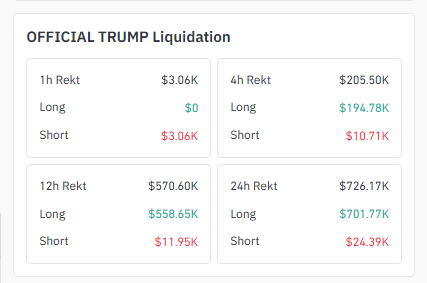
Source: Data Taken By Coinglass
That kind of one-sided liquidation usually means traders kept buying dips that didn't hold, and it often clears out weak long positions before a market can actually stabilize.
It's not necessarily bearish long-term, though. Flushing out overleveraged longs like this can actually set the stage for a healthier move once the selling pressure runs its course, since there's less forced selling left to weigh on price.
Volume Heatmap: Big Exchanges Are Still Driving TRUMP
Trading activity around TRUMP is heavily concentrated on a handful of major exchanges, with Binance and OKX leading the pack by a wide margin, followed by solid activity on Bybit and a mix of smaller platforms picking up the rest. 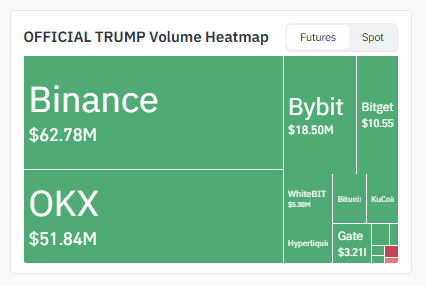
Source: Data Taken By Coinglass
That kind of concentration on top-tier exchanges usually means serious traders are still active in this name, even with the price cooling off from its highs.
Volume sitting this high on the majors is often a sign the market hasn't lost interest; it's just waiting for direction.
The 1H Chart: $TRUMP Stuck Inside a Descending Channel
On the 1-hour chart, $TRUMP is moving inside a descending channel, and it's a fairly textbook one.
Price keeps making lower highs and lower lows, drifting down between two parallel lines like it's sliding down a ramp.
Channels like this eventually run out of room, and once the price pushes out of either side, the move that follows tends to be quick. 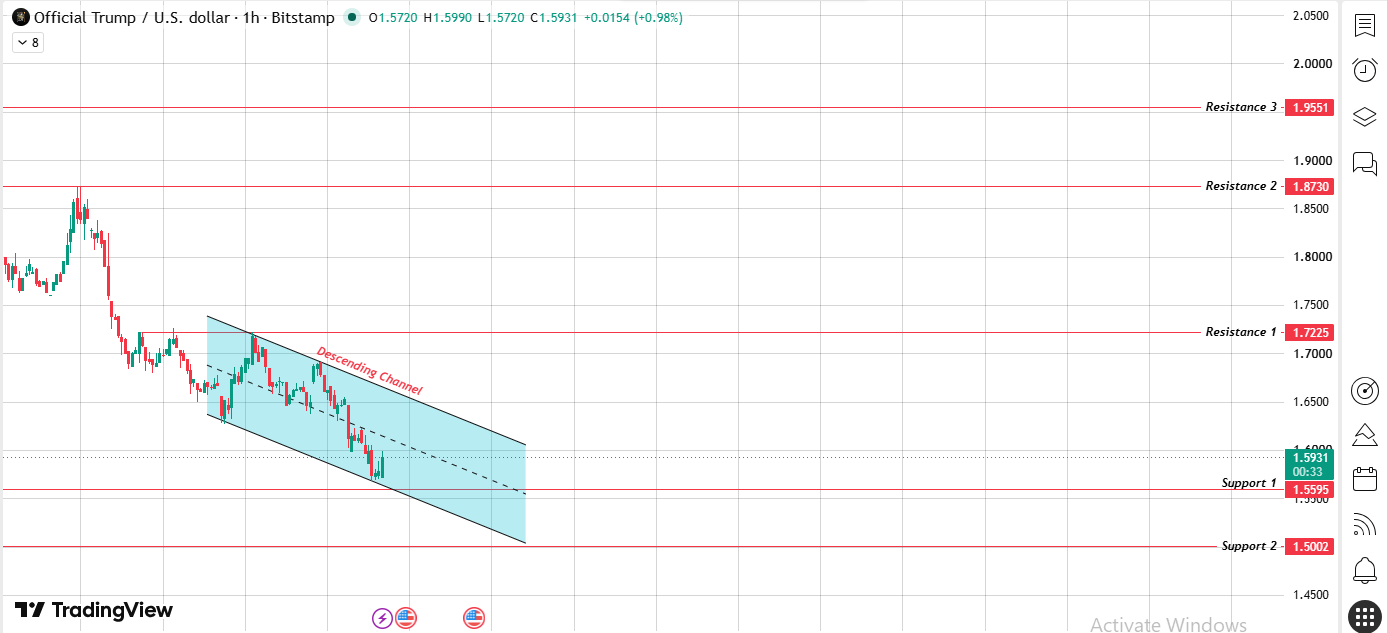
Source: Chart Taken By TradingView
If buyers step in and push the price back above the upper boundary of this channel, the next stop would be the resistance zone sitting just above, and from there, higher resistance levels come into play if momentum keeps building.
A break like this on the hourly can shift short-term sentiment fast, especially with how thin liquidity gets once price starts moving through these zones.
If, instead, the lower boundary breaks down, that's a sign sellers still have the upper hand short term, and the price could drift toward the support levels below.
Losing that support wouldn't be a minor move either; it would likely mean more downside pressure builds in the hours after.
This is exactly the kind of short-term swing that keeps feeding into the bigger official Trump price prediction 2027 conversation, since where Trump breaks now often sets the tone for the bigger structure playing out above it.
1H Key Levels:
| Level | Price (USD) |
|---|---|
| Resistance 3 | 1.9551 |
| Resistance 2 | 1.8730 |
| Resistance 1 | 1.7225 |
| Current Price | 1.5931 |
| Support 1 | 1.5595 |
| Support 2 | 1.5002 |
The 1D Chart: A Symmetrical Triangle Is Squeezing $TRUMP Tight
Switch over to the daily chart, and the picture becomes a lot more interesting. $TRUMP has been carving out a symmetrical triangle for weeks now, with lower highs coming down from one side and higher lows pushing up from the other.
The two lines are getting closer and closer, and that usually means the price is running out of room to keep moving sideways.
Symmetrical triangles don't tell you which way price will go, but they do tell you a move is coming, and often a sharp one. 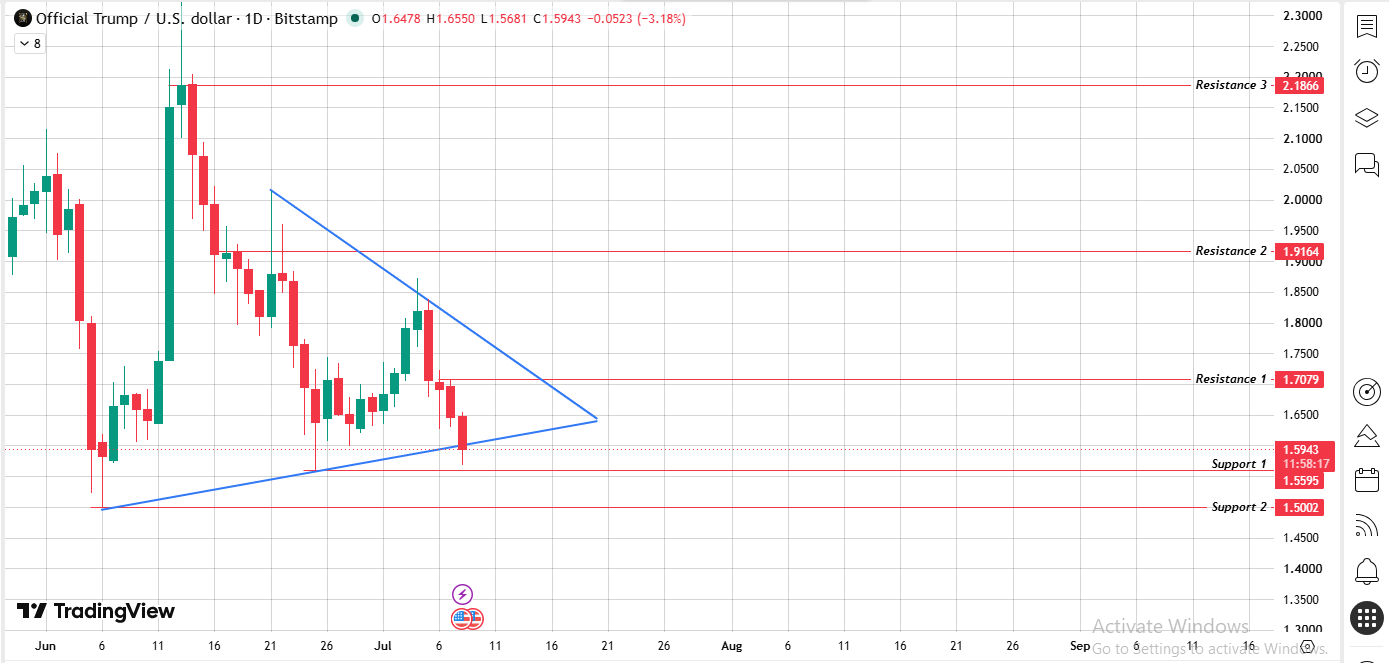
Source: Chart Taken By TradingView
If TRUMP breaks out above the top of this triangle, it opens the door toward the resistance levels stacked above, starting with the zone near 1.7079 and potentially stretching all the way up toward the higher levels near 1.9164 and 2.1866 if momentum really takes over.
Breakouts from a squeeze like this tend to move fast since there's usually a wave of buyers waiting for confirmation before jumping in.
On the other hand, if TRUMP breaks down below the bottom of the triangle, that opens the door to further downside, with the support zones near 1.5595 and 1.5002 becoming the next levels to watch.
A clean breakdown here would likely mean sellers are firmly back in control, at least for the next leg.
Right now, the triangle is still intact, so the safest read is to wait for a clear break in either direction before assuming which way this goes.
This daily structure is really the heart of the whole official Trump price prediction 2027 outlook, since whichever side this triangle breaks toward will likely define the bigger trend for a long time after.
1D Key Levels:
| Level | Price (USD) |
|---|---|
| Resistance 3 | 1.9551 |
| Resistance 2 | 1.9164 |
| Resistance 1 | 1.7079 |
| Current Price | 1.5943 |
| Support 1 | 1.5595 |
| Support 2 | 1.5002 |
Possible Official Trump Price Target for 2027
So what does 2027 realistically look like from here? If the symmetrical triangle on the daily resolves upward.
TRUMP clears its major resistance levels one after another; a push toward the 1.9164 – 2.1866 range becomes a realistic scenario, especially if broader market sentiment around political and meme-driven tokens stays strong.
That would represent a serious move from current levels and would likely need sustained volume plus a return of risk appetite across the wider crypto market.
If the triangle breaks down instead, $TRUMP could spend more time consolidating in the lower ranges before any real recovery attempt, which would obviously push any bigger target further out. Either way, this is a scenario, not a promise, and the actual outcome depends entirely on how price behaves at these key levels in the months ahead.
Bottom Line:
TRUMP is sitting right at a pressure point. The descending channel on the 1H and the symmetrical triangle on the daily are both signaling the same thing: a big move is building, and it's close.
Whether that move goes up toward new highs or down toward deeper support depends entirely on which side of these structures breaks first, and that outcome is really what will shape the official Trump price prediction 2027 story from here.
For now, keep an eye on the triangle boundaries and the channel levels, because once $TRUMP picks a direction here, it's unlikely to be a slow one.
Disclaimer:This article is for informational purposes only and is not financial advice. Crypto markets are highly volatile, so always do your own research before making any trading decisions.