Pi Network Price Prediction: PI Down 57% YTD, 97% Discount? Next Rally


PI is down 57% since the start of the year and sitting 97% below its lifetime high, numbers that have some holders calling this the bottom and others bracing for more pain.
Pi Network is a mobile-first crypto project that let millions mine PI for years before it launched onto open markets.
This Pi Network Price Prediction looks at whether the token's ascending trendline can hold one more time or whether the brutal year-to-date losses have further to run.
The next move at this trendline test could decide which side gets proven right.
Market data was checked on August 18, 2026, at 13:51 IST.
Pi Network Price Prediction Today: Market Overview
Metric | Value |
Price | $0.08620 |
Change | -0.17% |
Market Cap | $950.85M |
FDV | $8.6B |
24h Volume | $5.86M |
Vol/Mkt Cap (24h) | 0.6164% |
Total Supply | 100B PI |
Max Supply | 100B $PI |
Circulating Supply | 11.04B $PI |
Source: Data from CoinMarketCap as of August 18, 2026, at 13:51 IST. Figures may vary slightly across other tracking websites.
$PI News: Down 57% Year-to-Date
A post from BSCN, citing CoinGecko data, lays out how rough PI's year has been. The token is down 57% year-to-date, down 77% over the past 12 months, and trading at a 97% discount to its lifetime high.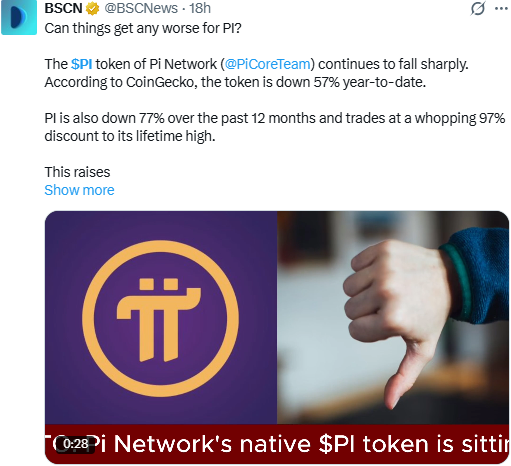
Source: Data From X
The post frames this as a genuine open question rather than a call in either direction: some holders see the sharp losses as a sign the bottom is already in, while others point out that current market conditions don't rule out further declines.
Note: Since these figures are sourced to CoinGecko, they're treated as reported data rather than an unverified claim.
$PI Price Prediction Chart: Technical Analysis
Pair: $PI/USDT · Market: Spot · Exchange: OKX · Timeframe: 4H · Source: TradingView · Timestamp: August 18, 2026, 13:51 UTC+5:30
$PI is trading at $0.08620, right at a rising trendline that's connected a series of higher lows since the late-July bottom near $0.07489.
Price broke off that trendline in early August, tagged the $0.08993 resistance zone, and has since drifted back down into a retest of the same trendline, now overlapping closely with the first confirmed support level.
The chart also flags a bearish EMA crossover around August 17, a tight squeeze that usually resolves with a sharper move once it breaks.
RSI (Relative Strength Index) reads 41.55, below the neutral 50 mark, showing momentum has cooled through the pullback without turning sharply oversold.
The EMA (Exponential Moving Average) cluster sits just above the current price, with the EMA 20 at $0.08693 and the EMA 50 at $0.08753, both acting as near-term resistance for any bounce off the trendline.
If the support holds, we could see a short-term upward move. However, if the support breaks, we may see further downside toward the next lower levels.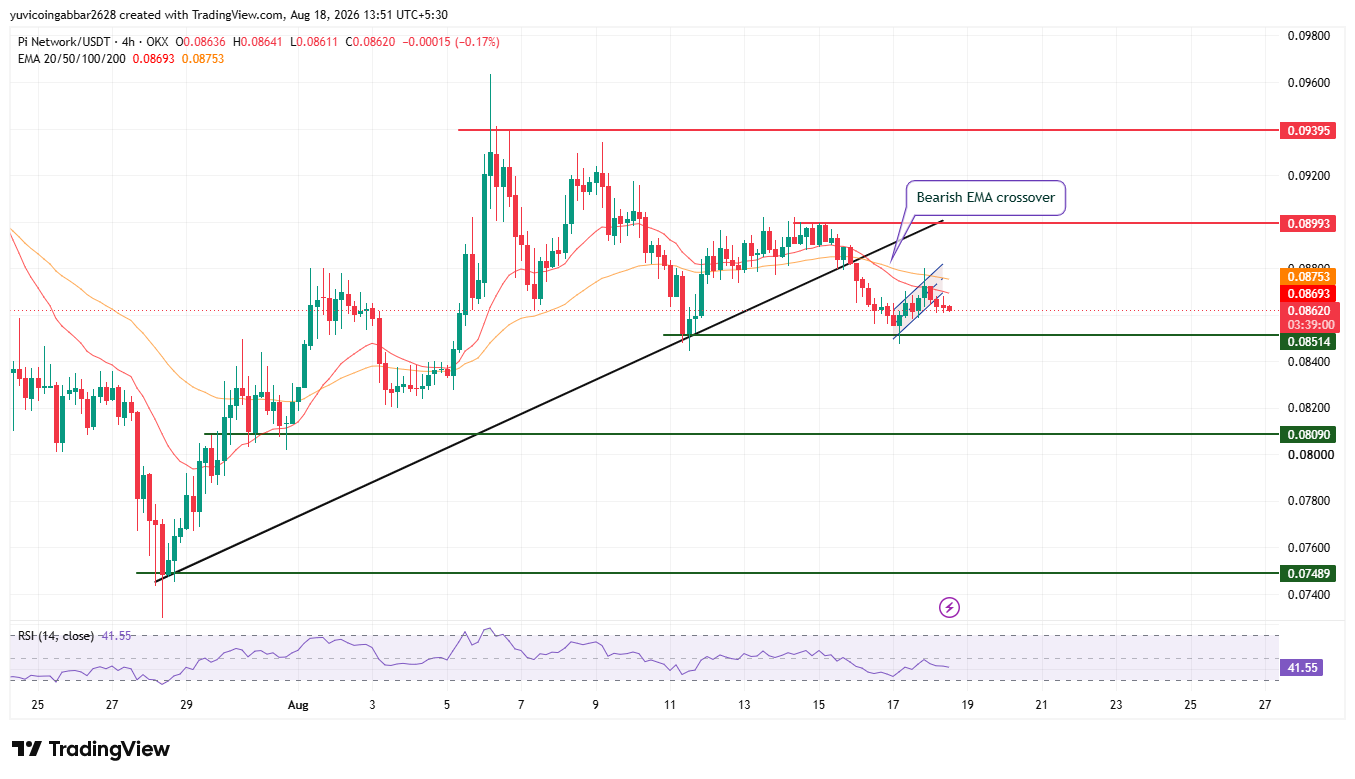
$PI future price: Important Trading Levels
Level Type | Price |
Resistance 2 | $0.09395 |
Resistance 1 (nearest) | $0.08993 |
Immediate Price Reference | $0.08620 |
First Support | $0.08514 |
Deeper Support | $0.08090 |
Structural Floor | $0.07489 |
$PI EMA Levels
EMA | Price |
EMA 20 | $0.08693 |
EMA 50 | $0.08753 |
Pi Network Forecast: Bull Case vs. Bear Case
$PI price target 2026 Bull case: Holding the trendline and the first confirmed support at $0.08514, then reclaiming the EMA cluster near $0.08693 to $0.08753 despite the recent bearish EMA crossover, would show buyers still defending the uptrend.
A confirmed move above the nearest resistance at $0.08993 would open the path toward $0.09395.
$PI price target 2026 Bear case: A break below $0.08514 would confirm the trendline has failed, adding technical weight to the bearish case some holders are already making off the 57% YTD drop.
Losing $0.08090 would expose the structural floor at $0.07489 as the next downside level.
Price Scenarios: Triggers and Invalidation
Scenario | Trigger | Likely Outcome | Invalidation Point |
Trendline hold | Price stays above $0.08514 | Range continues, bounce attempt toward EMA cluster | Close below $0.08514 |
EMA reclaim | Close above $0.08753 | The path opens toward $0.08993 and $0.09395 | Rejection back below $0.08693 |
Trendline breakdown | Close below $0.08514 | Drop toward $0.08090, then $0.07489 | Reclaim of $0.08514 |
PI Price Target: Can PI Reach $0.09395?
$0.09395 is the highest resistance level marked on the chart.
Reaching it would require PI to first hold the trendline and first confirmed support at $0.08514, work through the current bearish EMA crossover and rising-wedge squeeze, and reclaim the EMA cluster near $0.08693 to $0.08753.
Then clear the nearest resistance at $0.08993, a multi-stage recovery rather than a single leg, especially against a backdrop of steep year-to-date losses.
What Could Invalidate the Bullish Setup?
A close below the trendline and first confirmed support at $0.08514 would put the current uptrend structure in question.
A deeper break below $0.08090 and the structural floor at $0.07489 would undermine the recovery case entirely and would likely reinforce the more bearish reading of PI's 2026 so far.
Pi Network Price Prediction: Expert View
According to CoinGabbar analysts, PI's chart is at a genuine crossroads: price is sitting almost exactly on the trendline that's held every pullback since late July, and that line now overlaps with the first confirmed support at $0.08514.
A bearish EMA crossover just hit on August 17, and price is now squeezed into a tight rising wedge right at the trendline.
RSI at 41.55 shows sellers have some control but haven't pushed into oversold territory.
The 57% year-to-date decline and 97% discount to the lifetime high make this a psychologically loaded level, holders calling a bottom will be watching this exact trendline, and a failure here would likely accelerate the bearish narrative rather than just extend it.
For now, the $0.08514 to $0.08753 range is the zone that decides which side is right.
Disclaimer: This piece is for informational purposes only and isn't financial advice. The levels and scenarios above are based on technical chart analysis and publicly available data at the time of writing, and crypto markets can move sharply within hours, so past patterns don't guarantee future outcomes. It's worth doing independent research and considering your own risk tolerance before acting on any of the levels discussed here.
Also read:







.webp)








