Reason Behind $CASHCAT Drops 17% in 24Hr: Cash Cat Price Prediction


Cash Cat is one of the names popping up in trader group chats and crypto feeds this week, and the buzz has been hard to miss.
It trades under the ticker CASHCAT, according to its own listing page, and it's built up a full one billion coin supply already in circulation, which has kept traders watching how the community around it grows.
This Cash Cat Price Prediction looks at what's driving the chatter, where the crowd's excitement stands right now, and what could come next for anyone eyeing an entry or already holding.
With interest swinging between fear and greed this fast, missing the next move could mean missing the whole story. Stick around, because this one is worth watching closely.
Market data was checked on August 17, 2026, at 15:30 IST.
Cash Cat Price Prediction Today: Market Overview
Metric | Value |
Price | $0.10641 |
24h Change | -17% |
Market Cap | $106.3M |
FDV | $106.3M |
24h Volume | $21.46M (+48.02%) |
Vol/Mkt Cap (24h) | 20.26% |
Liquidity/Mkt Cap | 6.61% |
Total Supply | 1B CASHCAT |
Max Supply | 1B $CASHCAT |
Circulating Supply | 1B $CASHCAT |
Source: Data from CoinMarketCap as of August 17, 2026, at 15:30 IST. Figures may vary slightly across other tracking websites.
Cash Cat Liquidation and Volume Data
Liquidations (Coinglass Futures Data)
Timeframe | Total Liquidated | Long | Short |
1h | $60.62 | $0 | $60.62 |
4h | $60.62 | $0 | $60.62 |
12h | $431.07K | $430.72K | $355.78 |
24h | $442.71K | $442.35K | $355.78 |
Liquidation activity has been extremely light over the last 1h and 4h windows, just $60.62 total, all on the short side. 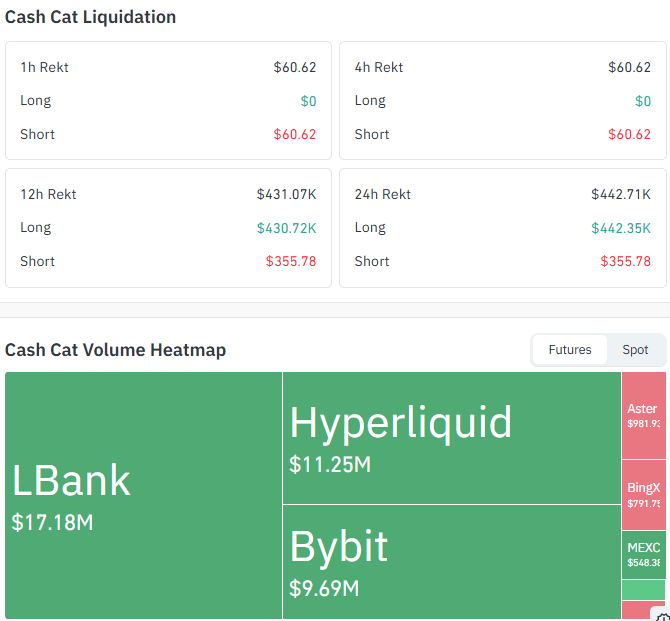
Source: Data From CoinGlass
The bigger picture over 12h and 24h shows the opposite: liquidations jumped sharply, and this time it's longs that got wiped out, with over $430K in long positions liquidated against a much smaller $355.78 in shorts.
That's a sign of a sharp move against long positioning sometime in the last 12 to 24 hours.
Exchange Volume (Futures)
Exchange | 24h Volume |
LBank | $17.18M |
Hyperliquid | $11.25M |
Bybit | $9.69M |
Aster | ~$981.9K |
BingX | ~$791.7K |
MEXC | ~$548.3K |
LBank is carrying the most futures volume by a good margin, followed by Hyperliquid and Bybit.
Cash Cat Chart Analysis: EMA and RSI Levels
Pair: CASHCAT/USDT · Market: Spot (Crypto) · Timeframe: 4H · Source: TradingView
CASHCAT is trading close to $0.10641 after a steep slide from its August highs.
The chart shows a bearish crossover between the EMA 20 and EMA 50 in mid-August, which came right before the price broke down through a range of support levels.
Since then, the price has cooled off and is now trying to steady itself just under the EMA 20, which sits in the $0.11825 range and is acting as the first wall of resistance on any bounce attempt.
RSI on the 14-period reading is below 40, which points to sellers still holding the edge, though the latest candle has ticked up, suggesting an early attempt to stabilize.
If the price holds current support and breaks the $0.10775 level while trading above the EMAs, we can assume a change in trend.
If the price breaks below the $0.09176 support, we could see more downside. 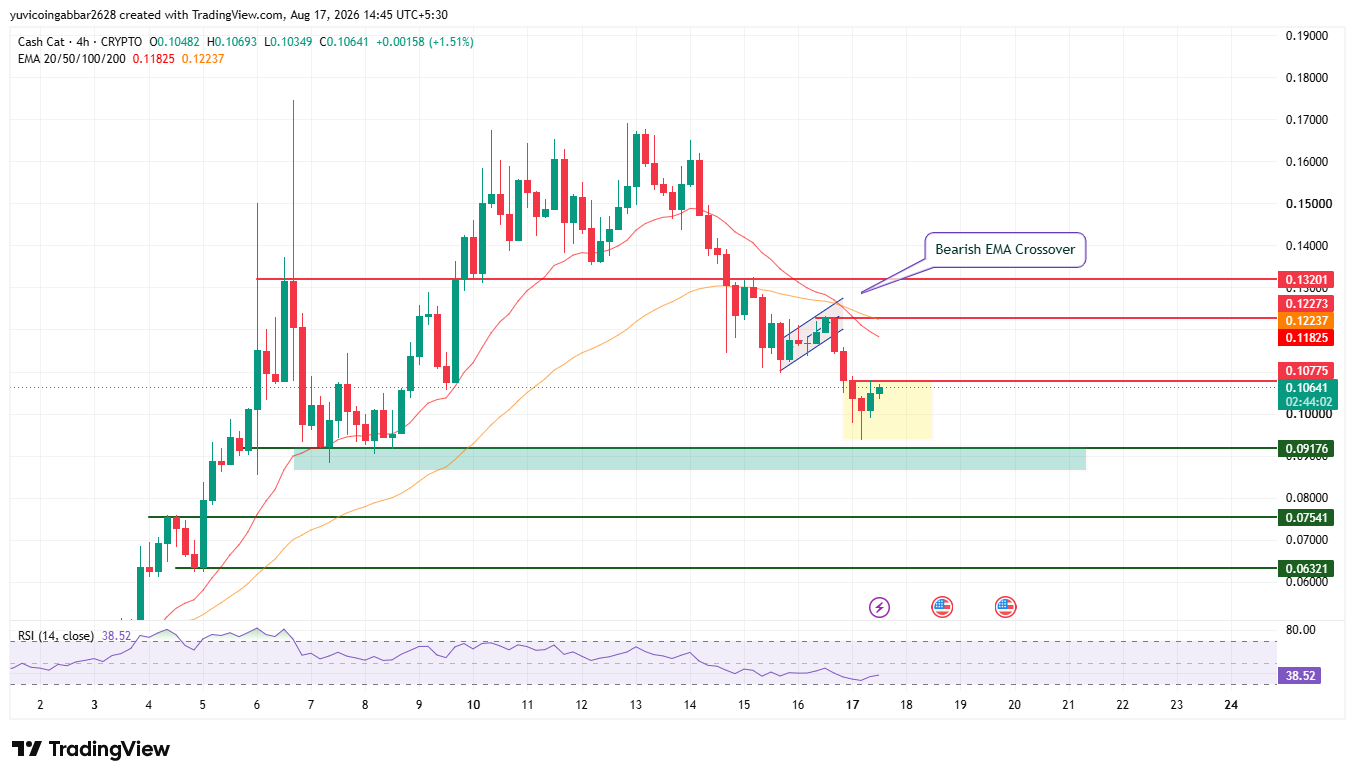
Support and Resistance Levels
Level Type | Price |
Resistance 3 | $0.13201 |
Resistance 2 | $0.12273 |
Resistance 1 | $0.10775 |
Immediate Price Reference | $0.10641 |
First Support | $0.09176 |
Deeper Support | $0.07541 |
Structural Floor | $0.06321 |
Cash Cat Forecast: Bull Case vs Bear Case
CASHCAT price target 2026 Bull case: Cash Cat holds above its first support zone and closes back above the EMA 20, showing buyers are stepping back in after the sell-off.
A push through the EMA 50 on rising volume would confirm the recovery and open the door toward the higher resistance levels above.
CASHCAT price target 2026 Bear case: Cash Cat fails to hold the first support zone and slips lower, with RSI staying under 40 as price keeps printing lower lows.
That would open the path toward the deeper support level, and a further break below that would put the structural floor in play.
Cash Cat Price Scenarios: Triggers and Invalidation
Scenario | Trigger | Likely Outcome | Invalidation Point |
EMA reclaim | CASHCAT closes above $0.10775 | Move toward the EMA 50 zone near $0.12237 | Rejection at $0.11825 |
Support hold | Price stays above $0.09176 | Consolidation continues in the current range. | Close below $0.09176 |
Support breakdown | Price closes below $0.09176 | Drop toward $0.07541 and the $0.06321 floor | Reclaim of $0.09176 |
Risk Note
CASHCAT just went through a fast rally and an equally fast pullback, and moves like this can swing hard in either direction on low notice.
Anyone watching these levels should size positions with that volatility in mind and treat every level here as a zone to watch rather than a guaranteed turning point.
Cash Cat Price Prediction 2026: Expert View
According to CoinGabbar analysts, The bearish EMA crossover and the drop in RSI both point the same way for now, and that is a market still working off its August rally.
What stands out is that the price has not broken the $0.09176 support yet, and the previous 4H candle closed green, so the sellers have not fully closed the door on a bounce.
The next few candles around the EMA 20 zone should give a clearer read on whether this turns into a real recovery or just a pause before more downside.
Disclaimer: This piece is for informational purposes only and isn't financial advice. The levels and scenarios above are based on technical chart analysis and publicly available data at the time of writing, and crypto markets can move sharply within hours, so past patterns don't guarantee future outcomes. It's worth doing independent research and considering your own risk tolerance before acting on any of the levels discussed here.
Also read:













.webp)








