Pi Network Price Prediction: $PI Test Triangle Support After Rejection


So what's the near-term Pi Network price prediction? It really comes down to one thing: does triangle support hold?
Buyers defend it, price breaks higher on volume, and $PI has a real shot at climbing toward resistance above.
Support gives way instead, and PI is likely heading lower before any recovery attempt gets going again.
Live PI Price Data
Pi Network is currently trading around $0.08318 right now, down 3.8% on the day after swinging between $0.08305 and $0.08683 over the last 24 hours.
Market cap sits at $914.121M against a fully diluted valuation of $1.406B, a gap that reflects how much supply is still locked up and waiting to enter circulation over time. 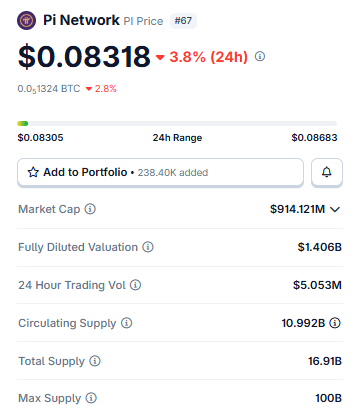
Source: Market Cap Data Taken From Coingecko, data as of Aug 03, 2026. Figures may vary slightly across other tracking websites.
24-hour trading volume came in at $5.053M, on the lighter side, which is worth keeping in mind since thinner volume can make breakouts and breakdowns move faster than they would on a heavier book.
$PI News Today
A crypto commentator flagged a supply-side concern this week: roughly 128 million mined $PI is set to unlock this month alone, and much of that tends to land on centralized exchanges once it's freed up.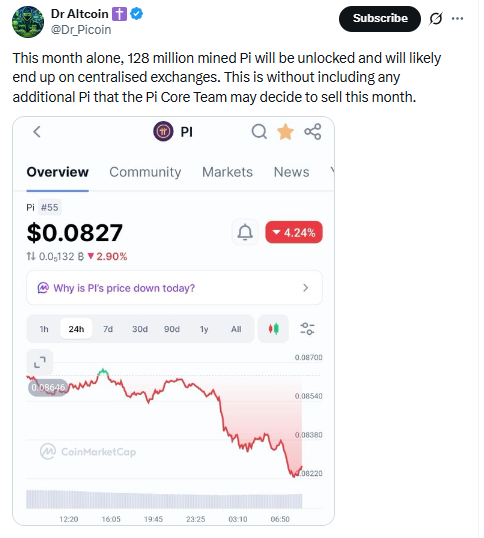
Source: Data Taken From @Dr_Picoin, X Account.
That figure doesn't even account for any extra tokens the Pi Core Team might choose to sell on top of it.
Fresh supply hitting exchanges around the same time as a pullback isn't exactly a coincidence traders like to see, and it lines up with why volume has stayed on the lighter side while price tests support.
Worth keeping in the back of your mind alongside the chart levels.
PI has been carving out a symmetrical triangle on the 4H chart, and the price just got rejected off the upper boundary near the $0.08800 zone. 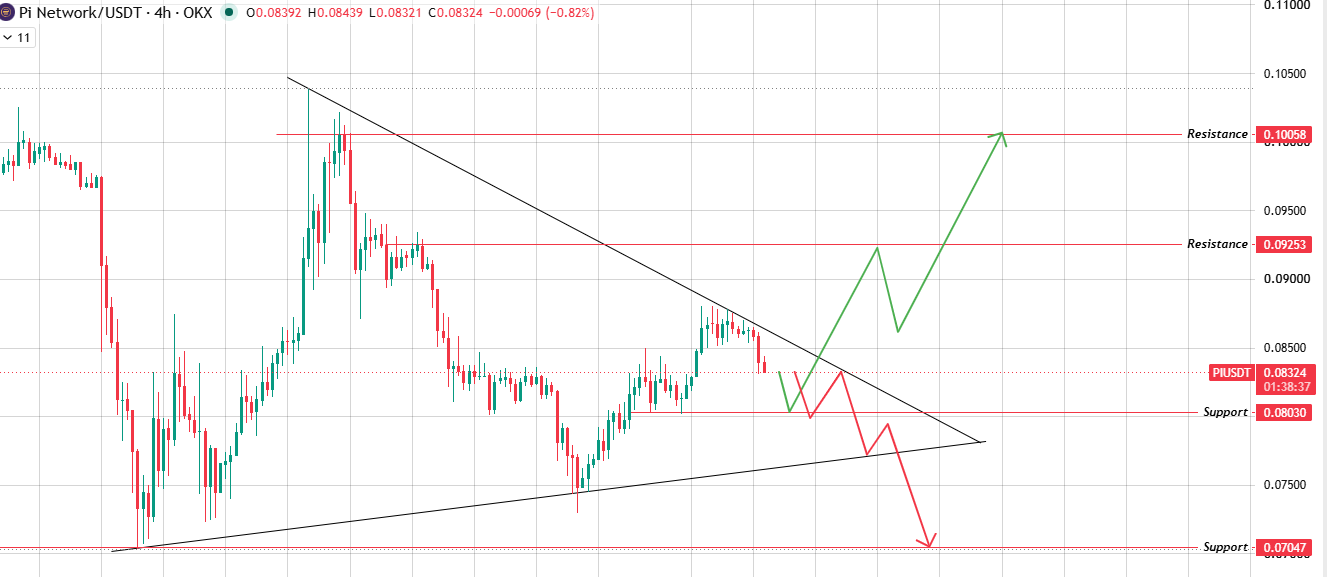
Source: Chart Taken From TradingView.
Right now it's trying to test the triangle's mid-range support around $0.08030.
Here's the setup. Bounce off this support with decent volume, break back above the upper boundary, and the path opens toward $0.09253, then $0.10058.
But if this support cracks, if sellers push through the lower boundary instead, PI likely slides toward $0.07047 next.
This Pi Network price prediction really hinges on which boundary gives way first.
Daily Chart Technical Analysis
Zooming out to the daily chart, the $PI is riding an ascending channel, currently sitting almost right on the channel's lower boundary near $0.08340. 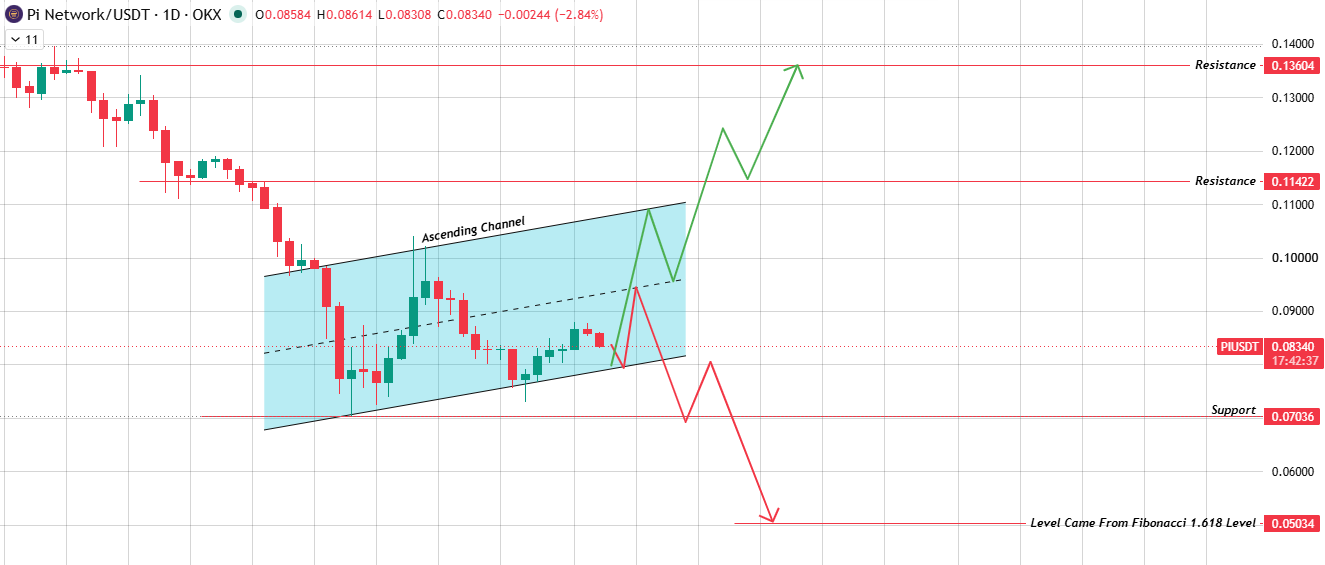
Source: Chart Taken From TradingView.
Two paths from here. Bounce off this level, clear the channel's upper boundary on volume, and resistance at $0.11422 comes into view, with $0.13604 possible after that.
Break the lower boundary instead, and support at $0.07036 is the first stop.
If that fails too, chart mapping points to a deeper Fibonacci 1.618 extension level near $0.05034, a level worth watching if the broader trend really breaks down.
Key Takeaways
PI is trading near $0.08318, down 3.8% on the day, right after getting rejected off the upper boundary of a 4H symmetrical triangle.
Hold the triangle support, break higher with volume, and $0.09253 comes into play, with $0.10058 next in line.
Lose that support instead? The triangle's lower boundary opens up, and $0.07047 is the next stop.
Over on the daily chart, PI sits close to the lower edge of an ascending channel. A bounce with a volume breakout targets $0.11422 and then $0.13604.
Break the channel's lower boundary instead, and $0.07036 comes first, with a deeper Fibonacci-based level near $0.05034 waiting after that.
Bull vs Bear Scenarios
What do bulls need? Triangle support holding, a break above the upper boundary on volume, and follow-through toward $0.09253 and $0.10058.
Get that momentum to carry into the daily ascending channel too, and the bigger targets of $0.11422 and $0.13604 open right up.
Bears want the mirror image. Triangle support fails, the lower boundary breaks, PI heads toward $0.07047 on the 4H chart, and the daily channel's $0.07036 support comes into play, with that deeper $0.05034 Fibonacci level lurking if things really unravel.
Both paths stay live here until a confirmed close picks a winner.
Methodology: This one's built on technical analysis of the TradingView 4H and daily charts, current market data, and supply metrics. None of it should be taken as financial advice.
Glossary
Symmetrical Triangle: Highs sloping down, lows sloping up, squeezing into a narrower and narrower range until price finally has to pick a side.
Ascending Channel: Two upward-sloping lines running parallel, keeping the price boxed in as it climbs.
Support Zone: A spot where buyers have shown up before, so traders keep an eye out for a repeat bounce.
Resistance Level: A spot where sellers have shown up before, so traders watch for the price to stall or reverse there again.
Fibonacci Extension: A ratio-based tool, 1.618 being a common one, that traders use to project where price might head after a big swing.
Disclaimer: This content is for informational purposes only and should not be treated as financial advice. Cryptocurrency markets, including Pi Network, are highly volatile and carry significant risk of loss. Always do your own research and consult a licensed financial advisor before making investment decisions.
3 weeks ago
Lord Bubuza has done it for me, His lottery spells are 100% active, He is real and can perform miracles with his spell. I am overwhelmed because I just won 336,000,000 million Euro from a lottery jackpot game with the lottery number he gave me after casting his lottery spell. I contacted Lord Bubuza for help to win a lottery via WhatsApp: +13658085313, he told me that a spell was required to be casted so that he can reveal my winning numbers, I provided his requirements to casting the spell and after casting the spell he gave the lottery numbers and I played and won 336,000,000 euros. How can I thank this man enough? His spell is real and he is like a God on Earth. Thank you for changing my life with your lottery winning numbers. Do you need help to win a lottery too? contact Lord Bubuza via WhatsApp: +13658085313 or e-mail: Lordbubuzamiraclework@hotmail.com ..

3 weeks ago
Lord Bubuza has done it for me, His lottery spells are 100% active, He is real and can perform miracles with his spell. I am overwhelmed because I just won 336,000,000 million Euro from a lottery jackpot game with the lottery number he gave me after casting his lottery spell. I contacted Lord Bubuza for help to win a lottery via WhatsApp: +13658085313, he told me that a spell was required to be casted so that he can reveal my winning numbers, I provided his requirements to casting the spell and after casting the spell he gave the lottery numbers and I played and won 336,000,000 euros. How can I thank this man enough? His spell is real and he is like a God on Earth. Thank you for changing my life with your lottery winning numbers. Do you need help to win a lottery too? contact Lord Bubuza via WhatsApp: +13658085313 or e-mail: Lordbubuzamiraclework@hotmail.com
3 weeks ago
I still can’t believe this is real, but I actually won the lottery jackpot! It feels like a dream come true. For years, I would occasionally play without expecting much, just hoping that one day luck would finally be on my side—and it finally happened when I came across a testimony on how Dr Benjamin the great spell caster had helped alot of people win, so I reached out to him, he told me what to do and I followed his instructions, after 48 hours he gave some numbers to play, I did played the numbers as instructed. The moment I checked my numbers and realized they all matched, my heart started racing. I had to double-check multiple times because I couldn’t believe what I was seeing. Winning the Powerball jackpot of $107,000,000,00. This has completely changed my life. It’s given me financial freedom, peace of mind, and the opportunity to support my family and invest in my future. Below his Email: drbenjaminlottospell711@gmail.com Whatsapp: +18588585788
3 weeks ago
I still can’t believe this is real, but I actually won the lottery jackpot! It feels like a dream come true. For years, I would occasionally play without expecting much, just hoping that one day luck would finally be on my side—and it finally happened when I came across a testimony on how Dr Benjamin the great spell caster had helped alot of people win, so I reached out to him, he told me what to do and I followed his instructions, after 48 hours he gave some numbers to play, I did played the numbers as instructed. The moment I checked my numbers and realized they all matched, my heart started racing. I had to double-check multiple times because I couldn’t believe what I was seeing. Winning the Powerball jackpot of $107,000,000,00. This has completely changed my life. It’s given me financial freedom, peace of mind, and the opportunity to support my family and invest in my future. Below his Email: drbenjaminlottospell711@gmail.com Whatsapp: +18588585788
1 month ago
Hello everyone am Gary Van I want to use this medium to appreciate a great spell caster called Dr Ogaga that transformed my life financially, I used to work as driver in a company and I always play lotto but I have never been lucky, then one day as I was glancing through the Internet I came across a testimony of a woman who won $600million through the help of a strong spell caster called Dr Ogaga after praying for her he gave her a lucky numbers to play and she won 600,000,000$ I also decided to try my luck I contacted the Dr Ogaga and he promise he was going to help me win too I didn't actually believed 100% but on the second thought I decided to give it a try He instructed me on what I need to do which I did with no stress at all, then after two day he sent me some numbers and asked me to go and play them I went strait to the store and play the numbers then I went back to check when the results were out, behold my numbers came out as the winning numbers it was like a dream to me, even till now I still fined it difficult to believe that I am now a millionaire from being a driver to being a millionaire all thank to Dr Ogaga I will never forget your help, if you are out there and you also want to be a winner I will advice you to also contact Dr Ogaga and I promise you he will not disappoint you at all. Here are his contacts. Email ogagaodia41@gmail.com WhatsApp +1(365)350-5955.
1 month ago
Good day sir/madam, I'm Vanessa Craig and it’s a lovely morning here. I am writing this article to inform everyone that just because we overlook certain information due to our lack of knowledge doesn’t mean it isn’t real. I am currently valued at more than £70 Million Pounds because I acknowledged this vital information. I had assistance from a man named Meduza I found online whose impressive testimonials about his spell work are legit and genuine. His lottery spell enabled me to win £65 Million Pounds in the lottery by providing me with the accurate winning numbers after he performed a lottery spell for me. I placed my full trust in him and followed his instructions without any hesitation and right now, I am proud to say that Meduza’s spiritual advice for winning the lottery is superb and outstanding. I am very grateful to him for his help. To learn more reach out to him via Whats_App +1 807 798-3042 Email: lordmeduzatemple@hotmail.com Website: lordmeduzaspelltemple.com
1 month ago
Greetings to the entire public, I am Dr. Ali Melita, I am a man that have come to put away every thought that is in EVERY ONE'S MIND THAT ARE SAYING THAT THERE ARE NO RELIABLE AND DURABLE LOAN COMPANY ONLINE THAT CAN GIVE LOAN no more. Well we all across the globe know that there are lots of scammers searching for our legit documents to use for fraud, So i Dr. Ali Melita the CEO of Daily Loan company worldwide HAS COME TO ANNOUNCE TO THE ENTIRE PUBLIC THAT this loan company know as Daily Loan company has come lend out money to serious minded and prospective clients that are in need of loan to settle there financial challenges. Any person/organization who HAVE BEEN LOOKING FOR LOANS AND HAVE NOT GOTTEN THE LOAN ON-TILL NOW SHOULD send their contact or apply via email: dailyloansitl@gmail.com. Services Rendered include; Refinance, Home Improvement, Investment Loan, Auto Loans, Debt Consolidation, Second mortgage, Business loans, Personal loans, Car Loans and more.. Greetings to the entire public, I am Dr. Ali Melita by name, I work with a RELIABLE, DURABLE AND A TRUSTWORTHY loan company called DAILY LOAN COMPANY. Are you into FINANCIAL debts? Do you have a bad credit score? Are you financially down. We give out loans at a very low interest rate of 3%. AND WE ALSO GIVE OUT LONG TERM LOANS for 2o years and above. We offer loans to serious minded business owners and also personal loan to those THAT NEED FINANCIAL ASSISTANCE TO BE ON THERE FIT, AND I WILL WANT TO ALSO LET YOU KNOW THAT THIS LOAN PROGRAM ARE FOR THE ONES THAT HAVE SINCERITY IN THEM. And if you are interested in this loan offer but not to make fun with it you can contact us via email: dailyloansitl@gmail.com Greetings to the entire public, Are you a business man or woman? Do you need a loan to be financially stable and also to celebrate this Christmas with your family and friends, Are you in any financial mess or do you need funds to start up your own business? Do you need loan to settle your debt or pay off your bills or start a nice business? Do you have a low credit score and you are finding it hard to obtain capital loan from local banks/other financial institutes? Do you need a loan or funding for any reason such as * Personal Loan * Business Loan * Home Equity Loan * Debt Consolidation Loan contact us via email: dailyloansitl@gmail.com for more details to get your loan funds to solve any of your financial problems.
1 month ago
My name is Darlene M, and I never imagined my life could change so fast. I was struggling with some unpaid bills and financial stress for years, and I was constantly wondering how people are able to win the lottery so big because I sometimes play the lottery but never won any big amount, I sought spiritual guidance from Chief Ade after I heard about him, how he has been helping people with the lottery winning numbers, and not long afterwards I won the $16,000,000 MILLION Lotto 6/49 Gold Ball jackpot with the numbers he gave me. That incredible win completely transformed my life. I was able to pay off all my debts, purchase a brand-new truck, and make sure my children had everything they needed to pursue their dreams. I also chose to share my good fortune by supporting local charities and helping families in need, because I know what it's like to struggle. I'm sharing this to remind whosoever seeing this that hope can inspire people to keep believing, even during difficult times. Email: chiefadespellhome@gmail.com || Whats App +234 901 380 6328
1 month ago
FROM CRAB FISHERMAN TO $64 MILLION LOTTO WINNER WITH LORD BUBUZA SPELL: I have been a crab fisherman for 40 years. I started working at a local fish plant a few years ago. I love playing lotto bets, so I buy lotto tickets often but find it difficult to win. I read about Lord Bubuza's lottery spells on the internet, so I contacted him for help to win Lotto 649. He told me that he would need to cast a lotto spell so that he can reveal the lotto numbers I will choose. I was sceptical, but my wife Nancy told me to give it a try. I provided his requirements to cast the lotto spells, and he gave me the numbers. I bought a Lotto 649 ticket and played as Lord Bubuza instructed, to my surprise it was a big win. I won $64,000,000. My partner Nancy and I travelled to the Atlantic Lottery in Moncton to confirm the win and collect the prize. I will retire from my crab fishing with this win and continue to recommend lord Bubuza. Join me and appreciate Lord Bubuza for his help via Email: lordbubuzamiraclework@hotmail.com or WhatsApp: +1 (365) 808 5313
1 month ago
I have been a crab fisherman for 40 years. I started working at a local fish plant a few years ago. I love playing lotto bets, so I buy lotto tickets often but find it difficult to win. I read about Lord Bubuza's lottery spells on the internet, so I contacted him for help to win Lotto 649. He told me that he would need to cast a lotto spell so that he can reveal the lotto numbers I will choose. I was sceptical, but my wife Nancy told me to give it a try. I provided his requirements to cast the lotto spells, and he gave me the numbers. I bought a Lotto 649 ticket and played as Lord Bubuza instructed, to my surprise it was a big win. I won $64,000,000. My partner Nancy and I travelled to the Atlantic Lottery in Moncton to confirm the win and collect the prize. I will retire from my crab fishing with this win and continue to recommend lord Bubuza. Join me and appreciate Lord Bubuza for his help via Email: lordbubuzamiraclework@hotmail.com or WhatsApp: +1 (365) 808 5313


















