Shiba Inu Price Prediction August 2026: Expert Outlook


$SHIB is currently trading around $0.000004603 right now, down 1.8% on the day and off 13.18% for the week.
That pullback matters for anyone trying to figure out where things go from here, and this shiba inu price prediction august 2026 works out to a range of roughly $0.00000405 on the low end to $0.00000710 on the high end, with the outcome largely riding on how price behaves at current support.
One thing worth flagging up front: the top 100 wallets control 83.05% of the entire supply.
As always, this is chart-and-data analysis, not a recommendation to buy or sell.
Shiba Inu Price Today: Live Data and 24-Hour Change
At $0.000004603, $SHIB has given back most of its recent bounce-down of 1.8% today, 13.18% over the past week.
Market cap sits at $2.714 billion against a circulating supply of 589.24 trillion tokens, putting fully diluted value at $4.606 billion.
That's the starting point for everything in this Shiba Inu price prediction August 2026.
| Metric | Value |
|---|---|
| Price | $0.000004603 |
| 24H Change | -1.8% |
| 7D Change | -13.18% |
| Market Cap | $2.714B |
| Fully Diluted Valuation | $4.606B |
| Circulating Supply | 589.24T SHIB |
| Total Supply | 589.497T SHIB |
| 24H Volume | $112.18M |
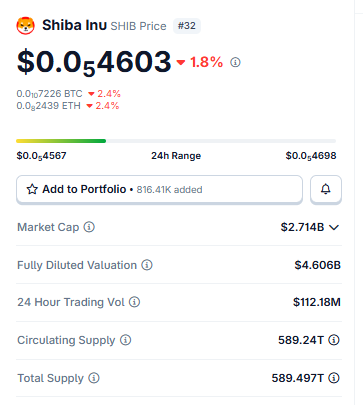
Source: Shiba Inu Market Cap Data Taken From Coingecko, data as of July 29, 2026. Figures may vary slightly across other tracking websites.
What Could Move the Price in August
Shiba Inu Holder concentration is really the story behind this Shiba Inu price prediction August 2026.
The top 100 wallets hold 83.05% of the supply, and when you narrow that down to just whale wallets, a tiny 0.04% of all holders, they still control a staggering 94.57% between them. 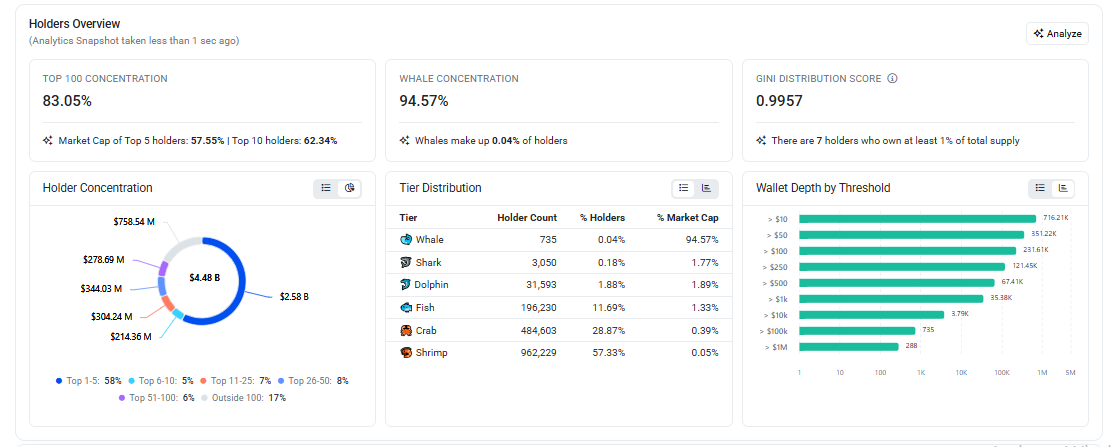
Source: Holder Data Taken From Etherscan.
That kind of skew means a small handful of addresses could move the price hard in either direction, almost regardless of what retail traders are doing.
Broader crypto flows matter too. Rising BTC dominance tends to starve altcoins like SHIB of liquidity, while falling dominance usually frees up capital that flows back into meme coins.
And because SHIB's liquidity runs mostly through Ethereum pairs, sharp ETH moves have a way of dragging SHIB along for the ride.
Reading the Chart: Support and Resistance
Zoom out to the weekly chart, and $SHIB is sitting inside a descending channel, with the price now currently trading at $0.00000461.
If the upper boundary of the channel breaks on real volume, that opens the path first toward $0.00000710, then $0.00001012, with $0.00001245 as the extended target if momentum carries through. 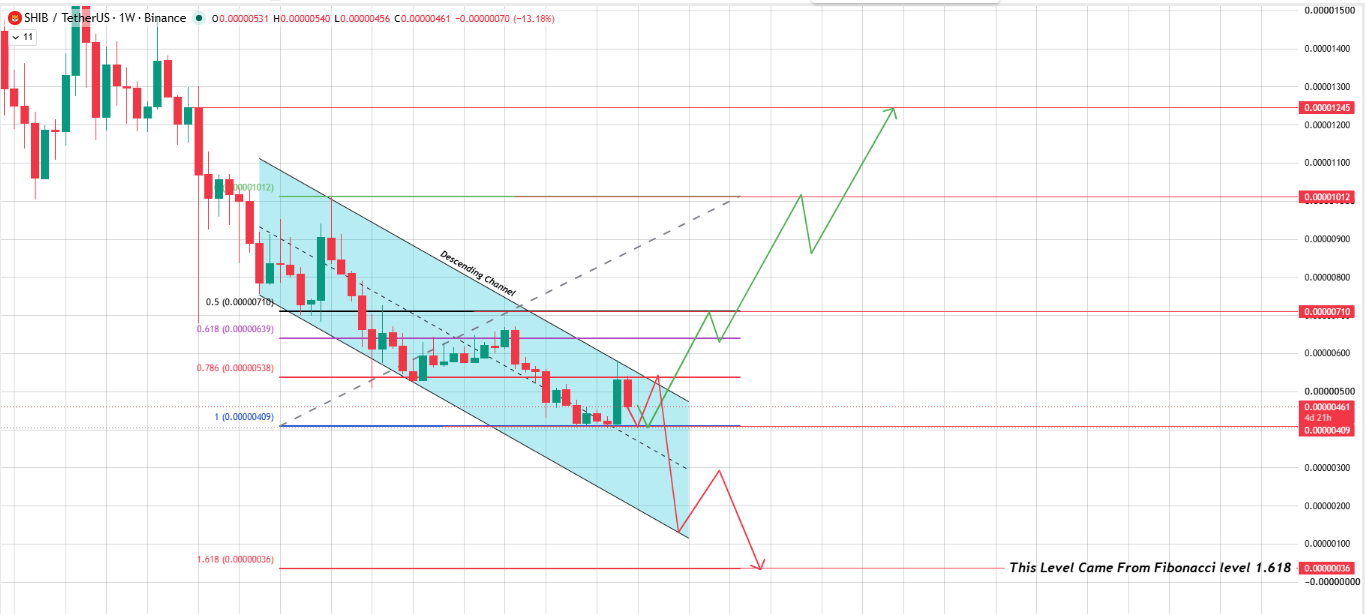
Source: Weekly Chart Taken From TradingView.
But if a breakout like that can't hold, the price tends to fall right back into the channel and retest these same support levels, with $0.00000036 as the extended downside support level if the channel breaks lower instead, so confirmation matters more than the initial move.
The weekly Fibonacci levels line up with this same structure.
Retracement levels sit at $0.00000710 (0.5), $0.00000639 (0.618), $0.00000538 (0.786), and $0.00000409 (1), with the $0.00000036 extended target coming from the 1.618 extension.
Right now, the price at $0.00000461 is sitting between the 0.786 level ($0.00000538) and the 1 level ($0.00000409). Inside that zone is effectively the same demand pocket discussed above, and it's the area buyers need to defend to keep the recovery case alive.
Daily Chart Analysis for Shiba Inu Price Prediction August 2026
On the daily chart, price had been consolidating before it broke out on volume, and now it's coming back to retest that breakout zone and fill in the fair value gap (FVG) left behind on the move up. 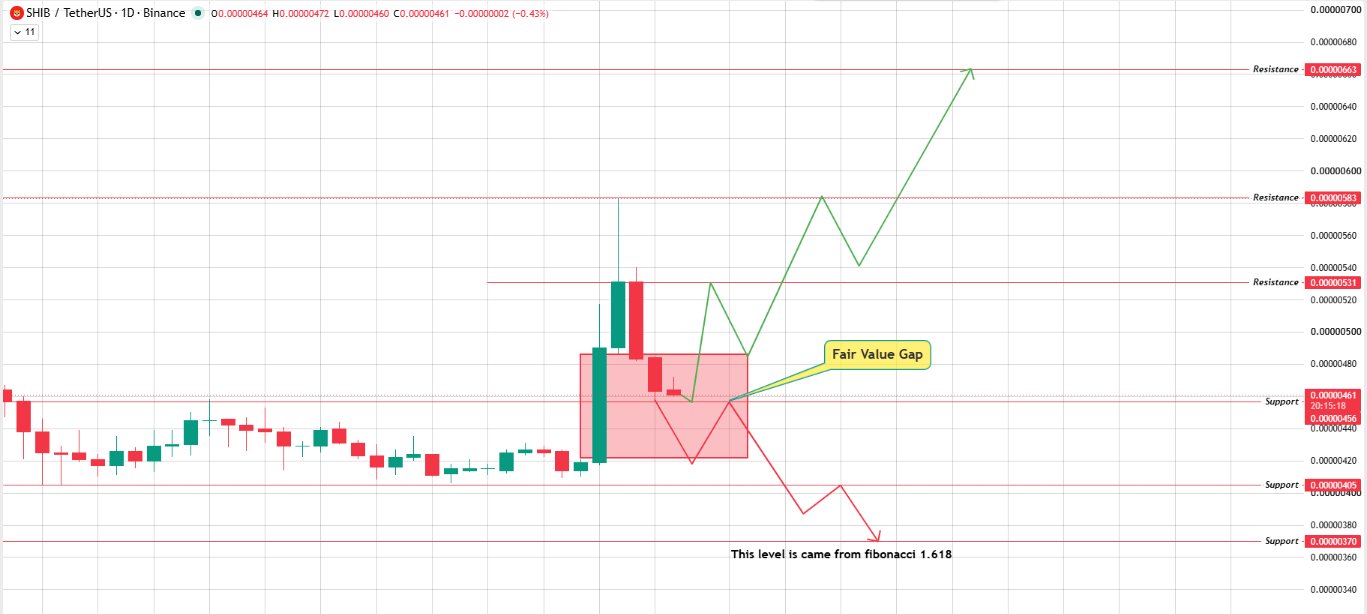
Source: Daily Chart Taken From TradingView.
Whether that gap gets filled and buyers step back in with volume decides the next leg: if volume shows up here, price should turn back toward the upper resistance levels; if it doesn't, price likely drifts back down toward support instead.
There's also something worth noting in the liquidation data: long positions are bunched up just above $0.00000531, so a break through that level could trigger a wave of short covering.
Below $0.00000405, liquidation clusters thicken up again, meaning a breakdown from there could move fast and ugly.
On a more encouraging note, exchange volume has been fading on red days and picking up on green ones this week, which hints that sellers near support might be running out of steam.
Bull, Base, and Bear Cases for August
Everything here comes down to a fairly narrow demand pocket between $0.00000456 and $0.00000461.
Which way the price breaks out of that zone more or less decides the Shiba Inu price outlook for August 2026.
| Scenario | August 2026 Target | Invalidation Level |
|---|---|---|
| Bull | $0.00000583 – $0.00000663 | Daily close below $0.00000456 |
| Base | $0.00000405 – $0.00000531 (Range-Bound) | Confirmed close outside either boundary |
| Bear | $0.00000405 – $0.00000370 | Break and hold below $0.00000370 |
For the bulls to take this, they'd need to reclaim $0.00000531 first, then push toward $0.00000583 with real volume behind it.
The base case is honestly less exciting; it's mostly a sideways chop inside the zone we're already in.
And bears get the upper hand if $0.00000405 fails to hold, which would open the door to the next shelf down near $0.00000370.
What the Charts Are Suggesting
Most chart-based reads on SHIB right now point to a wait-and-see setup rather than any obvious trend.
The weekly channel has compressed into a genuinely tight range, and squeezes like this tend to resolve with a sharp move once they finally break.
Sentiment stays cautiously constructive as long as the $0.00000405–$0.00000456 zone holds but flips bearish fast if that floor gives way.
Worth remembering: $SHIB has a track record of overshooting both its bullish and bearish targets once it actually gets moving.
None of this is individualized financial advice; it's analysis built from charts and on-chain data.
Crypto markets are volatile and can gap through price levels with no warning, and past patterns are no guarantee of what happens next. Do your own research, and think about talking to a licensed financial advisor before putting money in.
Looking Further Out: 2027 to 2030
If the $0.00000405 zone manages to hold through the rest of 2026, a slow climb back toward $0.00000710–$0.00001012 seems plausible over 2027 and 2028, based on how the chart has behaved in the past.
A break lower would obviously push that timeline back.
Where $SHIB actually lands by 2030 has less to do with any chart pattern and more to do with adoption, exchange liquidity, and whether the project survives a few more market cycles in one piece.
What Could Break This Forecast
The single biggest risk is that concentration number. With whale wallets sitting on 94.57% of supply, it wouldn't take many of them selling in sync to blow through support faster than the chart would suggest.
If $SHIB does slip below $0.00000370, that opens a deeper leg down, with an extended fib level near $0.00000036 acting as a tail-risk floor, though that scenario needs something close to a total breakdown and sits well outside the base case.
On the flip side, a liquidity rotation back into meme coins, often triggered by falling BTC dominance, could easily push targets past the top of the bull case.
Buying and Storing SHIB Safely
SHIB is available on most major exchanges, typically paired against USDT, USD, and BTC.
Given how low SHIB's unit price is, it's worth picking an exchange with solid liquidity to avoid unnecessary slippage.
Hardware wallets make sense for larger holdings, while software wallets are fine for smaller, more active positions.
Given the concentration numbers discussed above, sizing positions carefully is probably a good idea no matter your outlook.
Glossary
A support zone is basically a price area where buyers have shown up before and slowed things down.
Resistance works the other way; it's a spot that's capped rallies in the past. When you hear someone mention a trendline, they just mean a sloped line connecting a series of higher lows on the chart.
Then there's holder concentration, which is the amount of supply sitting in relatively few wallets; the higher that number, the more a handful of addresses could move the market if they decided to sell together.
BTC dominance is Bitcoin's slice of the total crypto market cap, and traders watch it as a rough signal for how much risk appetite exists for altcoins.
Last one: ETH correlation just describes how closely SHIB's price tends to move with Ethereum, which makes sense given how much of SHIB's liquidity actually runs through Ethereum pairs.
Methodology
This forecast draws on weekly and daily chart data, exchange volume trends, and wallet-level holder concentration figures current as of writing.
Every price level here comes directly from chart support, resistance, and Fibonacci structure; nothing is extrapolated beyond that.
For informational purposes only; this is not financial advice.]
Disclaimer: This Shiba Inu price prediction August 2026 is for informational and educational purposes only and should not be considered financial or investment advice. Cryptocurrency markets are highly volatile, and prices can change rapidly. Always conduct your own research and consult a qualified financial advisor before making any investment decisions.









.jpg)








