Shiba Inu Price Prediction: $SHIB Battles to Hold Weekend Gains


This Shiba Inu price prediction starts with where $SHIB actually stands.
Pulling back sharply today, sure, but still up double digits on the week even after the dip. Compared to Dogecoin and Pepe, both are cooling off from their own recent peaks.
The $SHIB move looks less like panic and more like normal profit-taking after a fast run. Buyers step back in with volume; a retest of recent highs is realistic. They don't, and $SHIB probably drifts lower before finding its footing again.
SHIB Price Snapshot
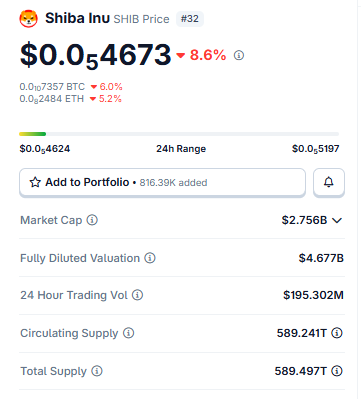
Source: Shiba Inu Market Cap Data Taken From Coingecko, data as of July 28, 2026. Figures may vary slightly across other tracking websites.
Shiba Inu History: Where This Coin Came From
A quick look at shiba inu history helps put today's move in context. $SHIB launched back in 2020 as a self-described Dogecoin alternative, and within a couple of years, it had built one of the largest holder bases in crypto, largely off community momentum rather than utility alone.
The shiba inu burn rate has become a recurring talking point since tokens were sent to dead wallets to permanently reduce supply, though burns alone rarely move price much without demand showing up alongside them.
More recently, the Shiba Inu Shibarium blockchain milestone updates and SHIB's own layer-2 network have added a utility angle that wasn't part of the original story at all.
Liquidation Heatmap: Who's Getting Squeezed
The liquidation heatmap makes it pretty obvious who's under pressure. Longs, again. $1.60M in long positions got wiped out over the last 24 hours, next to just $276.55K in shorts. 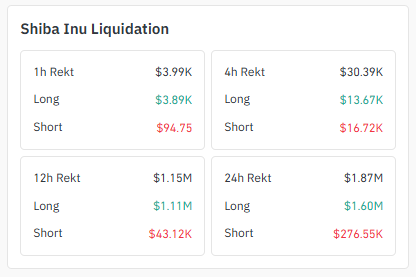
Source: Shiba Inu Liquidation Data Taken From Coinglass.
That imbalance shows up on shorter windows too; in the last 4 hours alone, $13.67K in longs got flushed against $16.72K in shorts, one of those rare stretches where shorts actually took slightly more heat.
Big picture, though, longs are still the ones getting caught offside during this pullback.
Exchange Volume Heatmap
Exchange volume for SHIB is spread out more than you'd expect for a meme coin. Binance leads at $14.38M, with Upbit closing behind at $11.83M, which is an unusually strong showing for a Korean exchange on this pair. 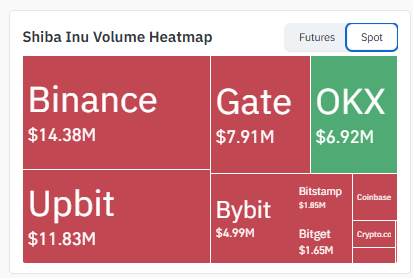
Source: Shiba Inu Volume Heatmap Data Taken From Coinglass.
Gate follows at $7.91M, then OKX at $6.92M, with Bybit, Bitstamp, and Bitget filling out smaller slices.
Volume split across this many venues, rather than one place dominating, usually means price discovery is happening in more than one spot at once.
Holder Concentration
Shiba Inu holder concentration on $SHIB is extreme. The numbers back that up too. Whale wallets, just 0.04% of all holders, control a staggering 94.58% of market cap. The top 5 wallets alone account for over 57% of that. 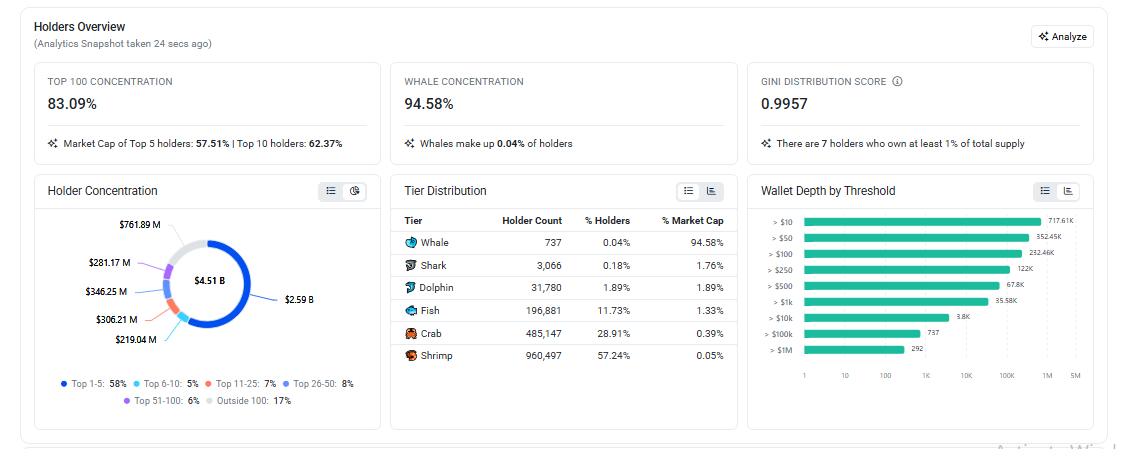
Source: Holder Data Taken From Etherscan, On 28-07-2026
A Gini score sitting near 0.9957 basically confirms what those figures already hint at: ownership here is about as lopsided as it gets.
Some of that ties back to locked or burn-related addresses rather than active whales trading around, but it's still worth watching.
Social Sentiment
On-chain trackers flagged a notable cluster of Shiba Inu whale activity over the weekend, with more than 52 transactions above $100,000 in a single day, the busiest stretch since late March.
Worth being careful here, though, that metric tracks transfer size, not direction. It doesn't actually tell you whether big wallets were buying or selling.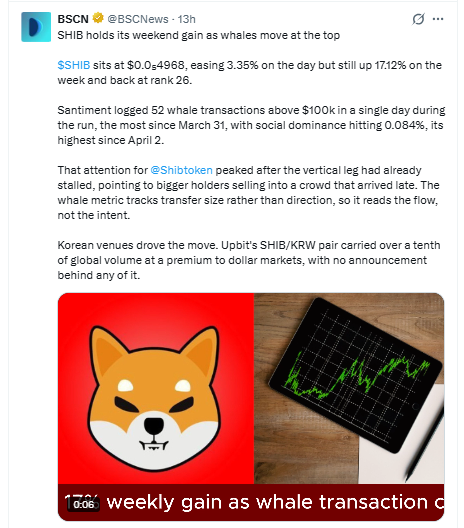
Source: Data Taken From @BscNews, X Account.
Timing adds a wrinkle too; this attention peaked after the vertical leg had already stalled out, which fits a pattern of larger holders selling into a crowd that arrived late rather than fresh accumulation.
Social dominance around SHIB hit its highest reading since early April during the same stretch, so eyes were clearly on the coin either way.
Korean exchanges did a lot of the heavy lifting on the volume side, with Upbit alone carrying over a tenth of global $SHIB volume at a premium to dollar-denominated markets, and there was no specific news or announcement behind the move.
Anyone keeping tabs on daily shiba inu coin news should treat this whale data as a flag to watch, not a clean bullish signal on its own.
4H Chart: Short-Term Structure
Zoom into the 4-hour view, and SHIB is coiling inside a symmetrical triangle, the upper trendline sloping down and the lower trendline sloping up, both converging fast now. Price sits right near the tip of it. 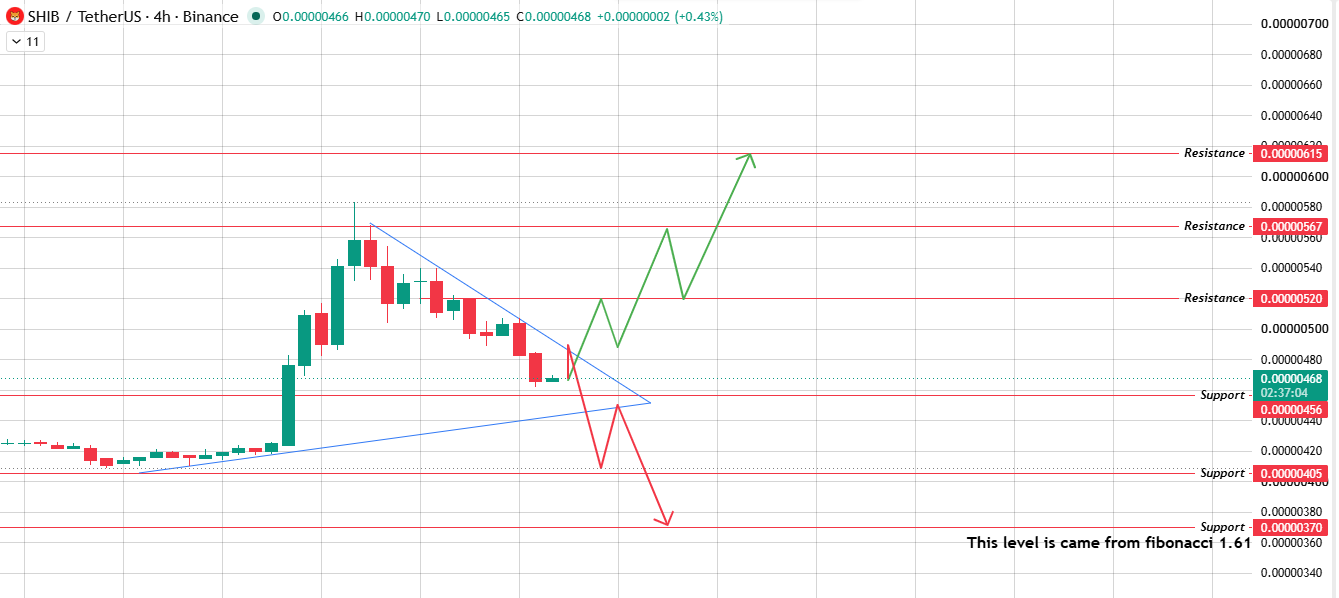
Source: Chart Taken From TradingView.
A breakout above $0.00000520 could carry SHIB through $0.00000567 and on to $0.00000615 if momentum follows through.
A breakdown through triangle support near $0.00000456 points the other way, toward $0.00000405 and possibly $0.00000370 if selling really picks up.
1D Chart: Shiba Inu Price Prediction Levels
The daily chart tells a fairly clean story here. $SHIB ripped higher off its base, then pulled back into a gap zone left behind by that move.
Somewhere between $0.00000421 and $0.00000485.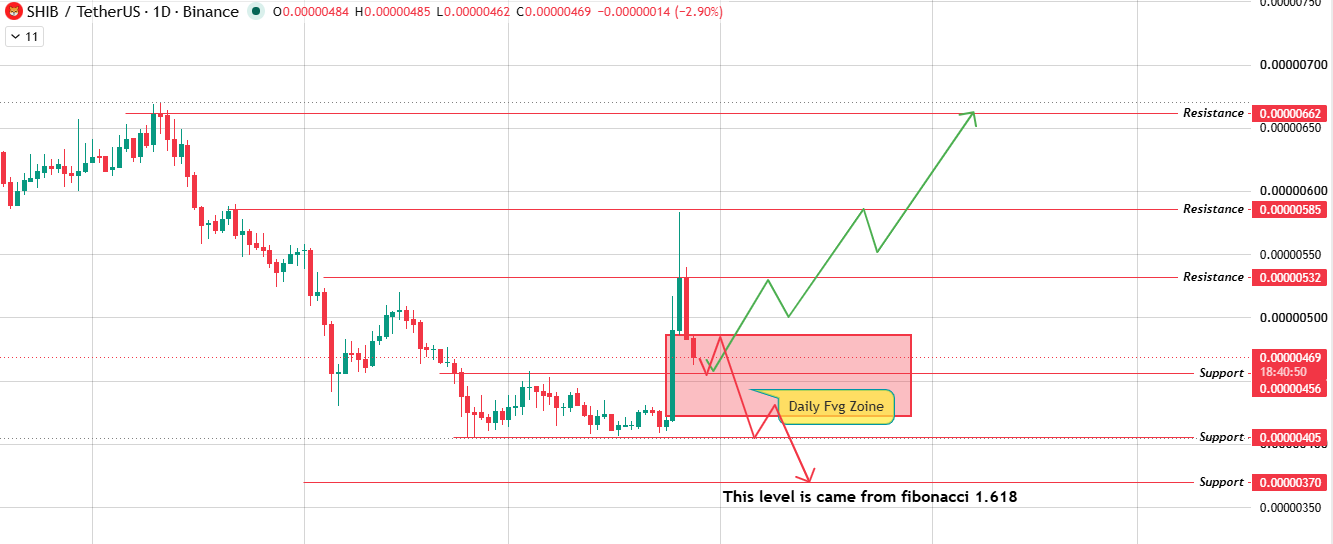
Source: Chart Taken From TradingView.
Hold this zone, and the path opens toward resistance level targets at $0.00000532, then $0.00000585, and then $0.00000662 further out.
Lose it, and the price likely slides to $0.00000405. Below that, $0.00000370 comes into play, a level pulled from Fibonacci extension math rather than guesswork.
Three-Scenario Outlook
Key Takeaways
-
$SHIB sits near $0.000004673 right now, down 8.6% today after a strong weekend run.
-
This shiba inu price prediction comes down to one thing really: whether the current triangle squeeze breaks up or down.
-
Longs took the brunt of the pain again, with $1.6M liquidated in 24 hours against just $276.55K in shorts.
-
Shiba Inu whale activity has picked up noticeably, and that kind of timing is rarely random.
BTC Dominance and ETH Correlation
BTC dominance has held in the mid-to-high 50% range through July 2026, which has kept broader capital rotation into meme coins somewhat limited.
SHIB's ETH correlation stays fairly tight too, tracking the wider altcoin market's mood more than charting its own independent course.
Dominance needs to ease up before rotation into smaller-cap tokens really picks up steam again.
Final Outlook
SHIB is coiled tight inside a shrinking triangle on the 4-hour chart, and this shiba inu price prediction really comes down to which side of it breaks first.
A confirmed breakout above $0.00000520 keeps the broader shiba inu rally narrative alive and opens the door toward $0.00000615.
A breakdown instead sends the price back toward $0.00000370.
With active whale wallets and volume spread across exchanges, this setup favors a decisive move soon. Just not a predictable direction yet.
Glossary
Symmetrical Triangle: Picture a price getting squeezed from both sides, a falling line above, and a rising line below. Once those two lines meet, the price usually breaks out sharply in one direction.
Trendline: Nothing fancy here, just a line connecting a series of highs or lows so you can see which way price has been leaning.
Support Zone: A price area buyers have defended before. Not a guarantee it will hold again, but worth watching.
Resistance Level: Basically the opposite of support. A zone where sellers have shown up in the past and capped further gains.
Holder Concentration: How much of a coin's total supply sits with just a handful of wallets versus being spread across thousands of smaller holders.
Burn Rate: Tokens sent to wallets nobody can access again, permanently taking them out of circulation. Faster burns, in theory, mean tighter future supply.
Methodology
Every price level in this article comes directly from the 1D and 4H charts referenced at the time of writing; nothing here is extrapolated beyond what's actually visible on the chart.
Liquidation and volume figures reflect a specific snapshot in time and can shift quickly. This article does not constitute financial advice.