Crude Oil Price Prediction: Can WTI Hold $91.283 After China Halt?


The crude oil price prediction for October 2026 begins with two opposing stories. China has cut its fuel exports, yet crude flows from the Middle East are close to pre-war levels.
West Texas Intermediate (WTI) is the main US benchmark for crude oil. It is priced for delivery at Cushing, Oklahoma, and quoted in US dollars per barrel.
For the latest crude oil price today, WTI trades at $92.29 per barrel. That is down $0.61, or 0.66%, on the day.
Live WTI Crude Oil Market Data
| Metric | Value |
| Instrument | CFDs on WTI Crude Oil (USOIL) |
| Price | $92.29 per barrel |
| Daily Change | -$0.61 (-0.66%) |
| Latest 4H Candle Range | $92.068 - $92.647 |
Source: Data Taken From TradingView (TVC feed) and FXCM 4-hour Chart, as of October 2, 2026
Crude Oil News Today Analysis
The main crude oil news today is China's suspension of refined fuel exports.
Visegrád 24 reported that Chinese refiners halted shipments of refined oil products to all regions beyond Hong Kong and Macau. It added that global oil prices rose about 2%.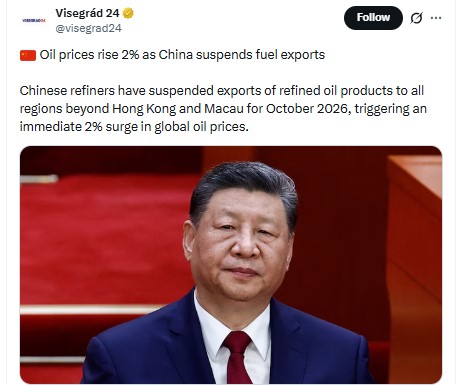
Source: Data Taken From @Visegrad24
Reuters confirmed the move on October 1, citing four people briefed on the matter. It reported that $WTI rose 2.28% to $92.48 that day.
The suspension runs until further notice, and one report says shipments could resume after the National Day holiday ends on October 7.
The cut covers refined products such as diesel, gasoline, and jet fuel, not crude itself. That matters because refined products were already in short supply.
Crude supply looks healthier. Citing a JPMorgan note, the Wall Street Journal reported that Middle East crude exports averaged 17.5 million barrels per day over 10 days.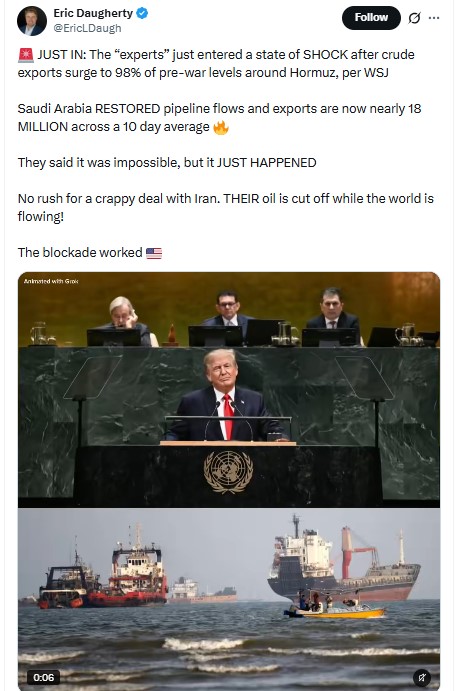
Source: Data Taken From EricLDaugh
That is about 98% of pre-war levels. Refined product exports sit near 3 million barrels per day, only 58% of pre-war volumes.
The two stories pull in different directions. Tight fuel supply supports prices, while recovering crude flows can limit gains.
WTI Technical Analysis
This WTI technical analysis uses the 4-hour chart of CFDs on Crude Oil (WTI) from FXCM, captured at 11:53 IST on October 2, 2026. The active candle closes at 15:30 IST.
Price is moving inside a descending triangle. A falling trendline from the mid-September high near $106 caps the upper side. A flat base near $88.933 has held since early September.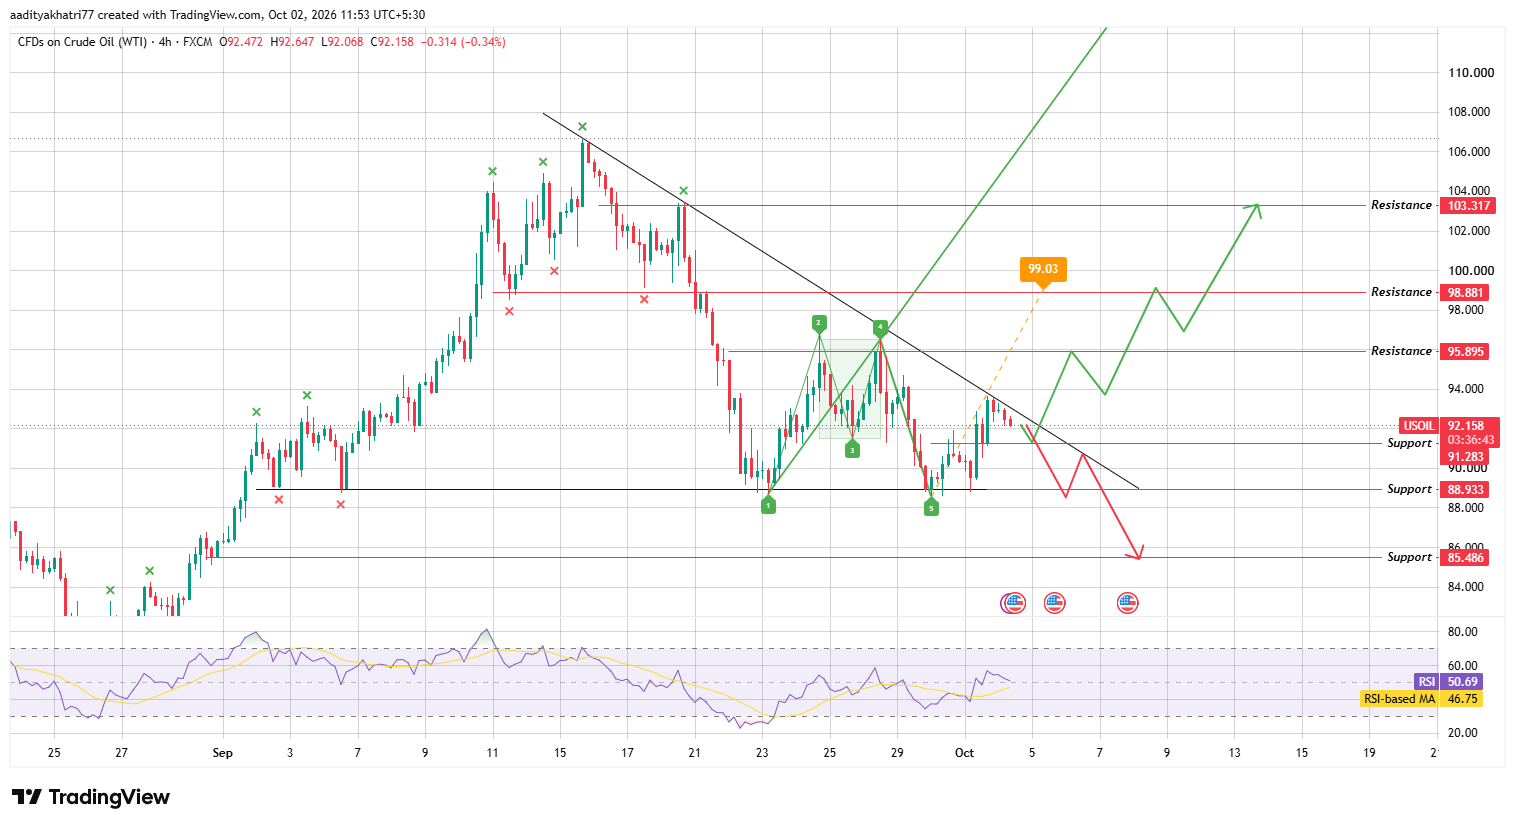
Source: Chart taken from TradingView, October 2, 2026
The chart also shows a wolfe wave. Its fifth point formed at the flat base in late September, and the projected line points toward $99.03.
That target holds only if the price bounces and clears the triangle structure.
Price tested the falling trendline on October 1 and slipped back. The trendline now sits just above the current price, near $93.
The RSI reads 50.69 against a moving average of 46.75, which signals neutral momentum with a slight upward lean.
Crude Oil Price Prediction: Can WTI Break Higher?
The bullish case needs a bounce from support first. The nearest floor is $91.283, only about 1.1% below the current price. A hold there would keep the wolfe wave setup alive.
The next step is a break of the falling trendline. A 4-hour candle should close above it, and tick volume should exceed the average of the previous 20 candles. A close on weak volume would leave the move open to a fade.
After that, resistance at $95.895 comes first, about 3.9% above today's price. The next level is $98.881, roughly 7.1% higher, which sits close to the $99.03 Wolfe wave target.
The final resistance is $103.317, about 11.9% above the current price. Reaching it would mean WTI has erased most of the decline from the mid-September high.
What Happens If WTI Breaks Support?
The bearish case starts when support gives way. A 4-hour close below $91.283 would show that buyers failed to defend the first floor.
The next level is the flat base at $88.933, about 3.6% lower. A close below it would complete the downward break of the triangle and cancel the Wolfe wave setup.
From there, the chart points to $85.486, a drop of about 7.4%. The China export halt could add pressure if it ends sooner than expected, because a tighter fuel supply would ease it.
Price Levels to Watch
| Support | Resistance |
| $91.283 | $95.895 |
| $88.933 | $98.881 |
| $85.486 | $103.317 |
Bull, Base, and Bear Scenarios
| Scenario | Setup | Level |
| Bull | Bounce from support, 4H close above the falling trendline with rising volume | $95.895, then $98.881 and $103.317 |
| Base | Price stays inside the triangle between the support and the trendline. | $91.283 - $93 |
| Bear | 4H close below support, then the flat base fails. | $91.283, then $88.933 and $85.486 |
WTI vs Brent
WTI usually trades below Brent, the global benchmark. On October 1, Reuters reported the December Brent contract at $100.09 per barrel, against $92.48 for WTI. That left a gap of about $7.6.
Brent therefore trades at a clear premium to WTI. The two benchmarks usually move in the same direction, so a sharp fall in Brent would add weight to the bearish case above. A steady Brent would keep the bounce scenario open.
Methodology
This US Oil price prediction uses four inputs. Levels, the triangle, the wolfe wave and the RSI come from the FXCM 4-hour WTI chart on TradingView.
The live price comes from the TradingView TVC feed, and the news items come from Visegrád 24, Reuters, and the Wall Street Journal.
Each signal depends on a closed 4-hour candle, since an open candle can reverse before it ends. All percentage moves are measured from $92.29.
The two price feeds differ by a few cents, which is normal for CFD quotes. Claims we could not verify were left out.
Expert Opinion
Commodity analysts quoted by Reuters describe the China export halt as another source of stress for fuel markets.
They add that its effect is smaller than the loss of Russian and Middle Eastern refined product supply.
Chart watchers apply a similar caution to descending triangles. The base often gives way, so a bounce needs a closed candle above the trendline first.
For this crude oil price forecast, that close is the clearest signal to wait for.
Disclaimer: This article is for information only and is not financial advice. Oil prices are volatile and can gap on geopolitical news. WTI can fall below every support level named here, including a decline of more than 7% in the bear case. No scenario is guaranteed, and readers should research independently and trade only with money they can afford to lose.












.webp)








