Crude Oil Price Prediction: $100 Next? WTI Teases a Major Breakout


One post on X says oil could pass $300 a barrel, yet WTI crude oil trades near $89 today.
That gap frames this Crude Oil Price Prediction October 2026, because a long-term claim says little about the weeks ahead.
West Texas Intermediate, known as WTI, is the main US oil benchmark. It is priced in US dollars per barrel and is widely used as a reference for energy markets.
The crude oil price today is $89.32 per barrel, up 0.44% today.
And this Crude Oil Price Prediction reviews market data, the latest news, and the outlook for October.
Live WTI Crude Oil Market Data
Metric | Value |
Instrument | CFDs on WTI Crude Oil (USOIL) |
Price | $89.32 per barrel |
Daily Change | +$0.39 (+0.44%) |
Latest 4H Candle Range | $89.192 - $89.503 |
Latest 4H Candle Close | $89.308 |
Price Time | 11:37 IST, Sep 30, 2026 |
Source: market data taken from TradingView (TVC), as of Sep 30, 2026, 11:37 IST. Chart prices from FXCM may differ slightly.
The 4-hour candle on the chart is down 0.18%, while the daily reading is up 0.44%. The two figures cover different periods, so they do not conflict.
A CFD quote follows the futures market closely. It can still differ by a few cents from exchange prices, so traders should check their own platform before acting on any level.
Crude Oil News Today: Long-Term $300 Call Draws Attention
The latest crude oil news today comes from social media. One account on X shared a chart from a market chart provider, saying oil is likely to pass $300 a barrel and could spike above $360 before settling between $150 and $250.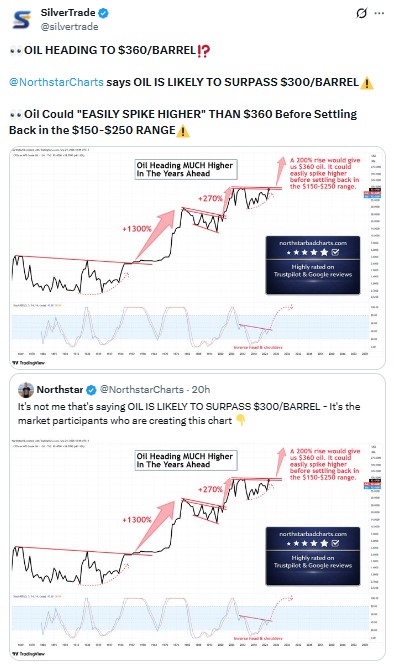
Source: Data taken from @SilverTrade X posts, as of Sep 30, 2026
The chart is titled "Oil Heading Much Higher in the Years Ahead." It marks past rallies of 1,300% and 270%, and it describes a further 200% rise as the path to $360.
Treat this as an unverified, long-term view. It is not a forecast for October. The post's own math, a 200% rise to $360, implies a starting point near $120, well above today's price. Reaching $360 from $89.32 would mean a rise of about 300%.
Crude Oil Technical Analysis
This crude oil technical analysis uses the 4-hour USOIL chart (CFDs on WTI Crude Oil) from FXCM, viewed on Sep 30, 2026, at 11:44 IST (UTC+5:30).
In this timeframe, WTI is moving inside a descending triangle. A falling trendline runs down from the September 16 high near $106.6, while a flat lower boundary sits near $88.5. 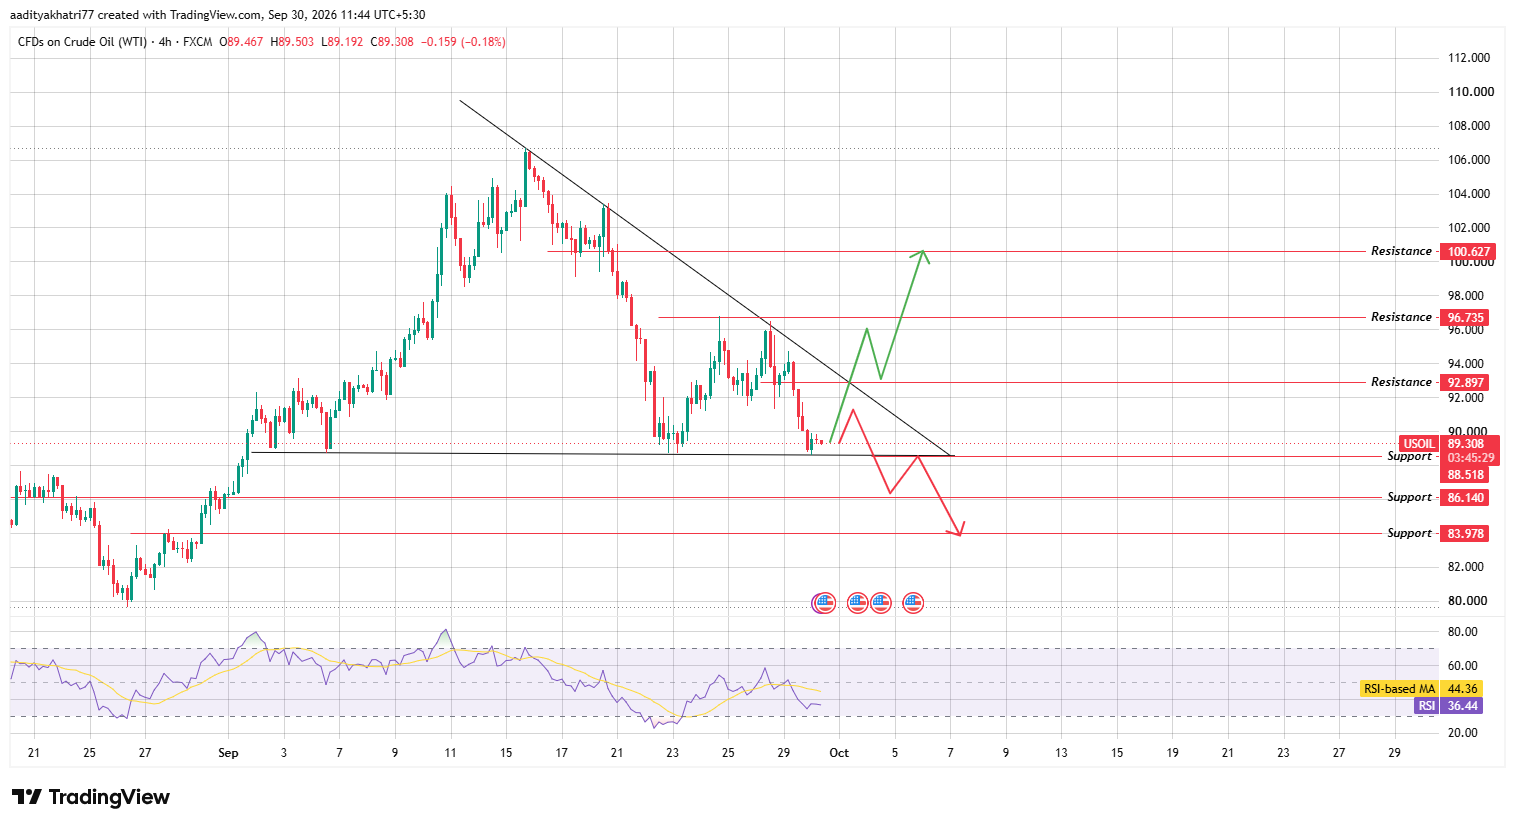
Source: Chart taken from TradingView, FXCM USOIL 4-hour chart, as of Sep 30, 2026, 11:44 IST
The falling trendline meets the $92.897 resistance around October 1, and the two lines converge near October 7.
Price has fallen roughly 16% from that high. The flat boundary has held at least twice before, around September 6 and September 23.
The latest 4-hour candle trades at $89.308, just above the $88.518 support and below the $92.897 resistance.
RSI reads 36.44 and sits below its moving average of 44.36. It is well under the 50 midline but still above the 30 mark, so momentum favors sellers for now.
Can WTI Break The Falling Trendline?
The bullish case starts with a bounce from the $88.518 support. If buyers defend it, the price can rise to test the falling trendline and the $92.897 resistance together.
A 4-hour candle close above both would confirm a break of the triangle. Volume should also exceed the average of the previous 20 candles.
The next resistance sits at $96.735, followed by $100.627.
The green path on the chart shows a pullback toward $93 after the first push, which is common after a breakout. A break without volume can fail and drop back inside the triangle.
What Happens If The Bounce Fails?
The bearish case begins with a weak rise that stalls below the $92.897 resistance. Low RSI makes a fragile bounce more likely.
A 4-hour close below the $88.518 support would break the base of the triangle. The first target is $86.140, and the next is $83.978.
The red path on the chart shows a retest of the broken support before the last leg lower.
Crude Oil Price Levels to Watch
These crude oil price levels come from the zones marked on the 4-hour chart.
Support | Resistance |
$88.518 | $92.897 |
$86.140 | $96.735 |
$83.978 | $100.627 |
Crude Oil Price Prediction: Bull, Base, and Bear Scenarios
Scenario | Setup | Level |
Bull | 4-hour close above $92.897 and the falling trendline | $96.735 to $100.627 |
Base | Range trade inside the triangle | $88.518 to $92.897 |
Bear | 4-hour close below $88.518 | $86.140 to $83.978 |
Crude Oil And The Macro Backdrop
Oil is priced in US dollars, so dollar strength often weighs on it. Supply news also drives price, including OPEC+ decisions, US inventory reports, and geopolitical events.
A breakout or breakdown from the triangle can be sharp when such news arrives. Traders should expect gaps and fast moves around major releases.
Methodology
This crude oil price prediction 2026 update uses the 4-hour USOIL chart from FXCM on TradingView. The triangle boundaries, RSI, and the RSI-based moving average were read candle by candle.
The trendline values quoted in the text are approximate readings from the chart.
Support and resistance levels come directly from the zones marked on that chart. The live price comes from a TradingView snapshot.
The long-term post comes from an X screenshot, dated Sep 30, 2026, and it was not used to set any level.
Nothing here replaces independent research. A chart pattern describes probability, not certainty, and a 4-hour setup can change within a few candles.
Expert Opinion
Taken together, the chart supports a cautious crude oil price forecast for October while WTI stays below the falling trendline.
RSI is under its average, and the $88.518 support is the level to watch.
Still, that support has held before, and a bounce from it would shift the balance. A confirmed 4-hour close above $92.897 would favor buyers, while a close below $88.518 would favor sellers. This is general market commentary, not a guarantee of direction.
Disclaimer: This article is for informational purposes only and does not constitute financial advice. Commodity markets, including crude oil, carry high volatility and downside risk; prices can move sharply against any projected level, and past performance offers no guarantee of future results. Readers should conduct independent research before making any investment decision.











.webp)











