Hedera Price Prediction: HBAR Builds Toward 0.07156


Hedera has been quietly building momentum, and network activity data released this week is giving HBAR holders another reason to pay attention.
On the chart, price is now testing a trendline that has held firm since mid-August, and the reaction here matters for anyone tracking this Hedera price prediction.
This is not financial advice, and the levels discussed below are drawn from a 1-hour HBAR/USDT perpetual chart on Binance, so they reflect a short-term, intraday to multi-day view rather than a long-term forecast.
HBAR Market Snapshot Today
Hedera (HBAR) is trading at $0.06787, up 3.48% on the day.
Futures volume over the past 24 hours stands at $67.32M against spot volume of $12.58M, showing that leveraged trading is currently driving a larger share of activity than spot buying.
Open interest, the total value of all open futures and perpetual contracts that have not yet been settled, sits at $104.53M.
Market cap is $2.97B against a circulating supply of 43.83B , with total and max supply both at 50.00B, meaning most of the eventual supply is already in circulation.
Source: CoinGlass, August 19, 2026.
Methodology and Data Sources for This Hedera Price Prediction
This Hedera price forecast is built from a 1-hour HBAR/USDT perpetual chart on Binance, viewed through TradingView.
The ascending trendline and the higher-high retest referenced below are marked directly on that chart.
Price, volume, open interest, and liquidation figures are sourced separately from CoinGlass and are cited individually below with their own timestamps.
The forecast horizon here is short-term, generally the next few hours to a few trading days, and should be rechecked if the price closes meaningfully beyond the range discussed.
Hedera Network Activity Hits Fresh Highs
A fresh data point adds a fundamental tailwind to this HBAR technical analysis.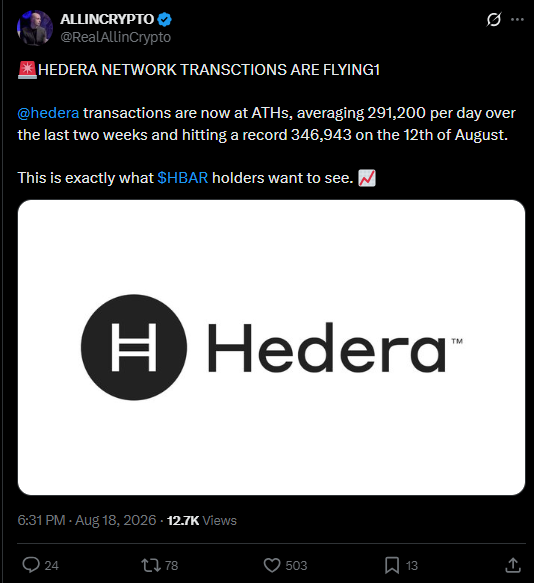
Hedera network transactions are now running at all-time highs, averaging 291,200 per day over the past two weeks and hitting a record.
346,943 on August 12. Rising on-chain transaction counts typically reflect growing real-world usage of the network, and this kind of activity spike often gets cited by holders as a supporting factor alongside price strength.
Source: @RealAllInCrypto on X, August 18, 2026, 6:31 PM.
Hedera Liquidation Data Today
Liquidation activity leans heavily one-sided across every timeframe.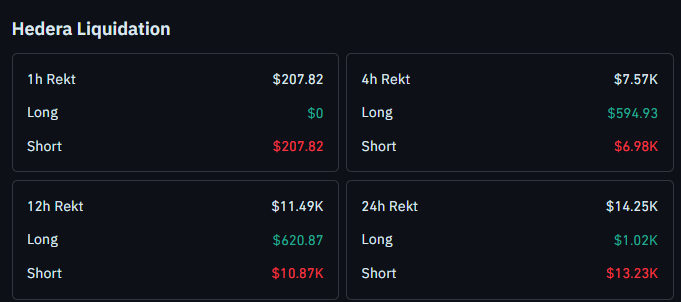
Over the past hour, total liquidations were light at $207.82, entirely on the short side with $0 in long-side liquidations.
Over four hours, short-side liquidations led at $6.98K out of $7.57K total, with only $594.93 coming from longs.
The 12-hour window shows the same pattern, $10.87K in short-side liquidations against $620.87 on the long side, out of $11.49K total.
Zooming out to 24 hours, short-side liquidations remain dominant at $13.23K against just $1.02K in long-side liquidations, out of a total $14.25K.
This consistent short-side liquidation pressure across every window lines up with the aggressive upward move on the chart, suggesting short sellers have repeatedly been caught offside as HBAR pushed higher.
Source: CoinGlass, Hedera liquidation data August 19, 2026.
HBAR Price Right Now and Key Levels to Watch
CMP: $0.06792 (Binance HBAR/USDT perpetual, 1h chart)
24h Change: +3.48% (per CoinGlass)
Trendline support zone: 0.06709
Upside trigger levels: 0.07003, then 0.07156
Downside confirmation: aggressive close below 0.06514
Next support if downside confirms: 0.06424
Data captured: August 19, 2026, approximately 10:56 AM IST (5:26 AM UTC)
A quick risk note before going further: HBAR's leveraged futures market is comparatively thin next to its spot volume, which can make moves around trendline levels sharper than usual, so these levels should be treated as reference points rather than guarantees.
HBAR Price Prediction: 1-Hour Chart Analysis
HBAR is currently testing support at an ascending trendline on the 1-hour chart, and how it behaves here will likely set the tone for the next move.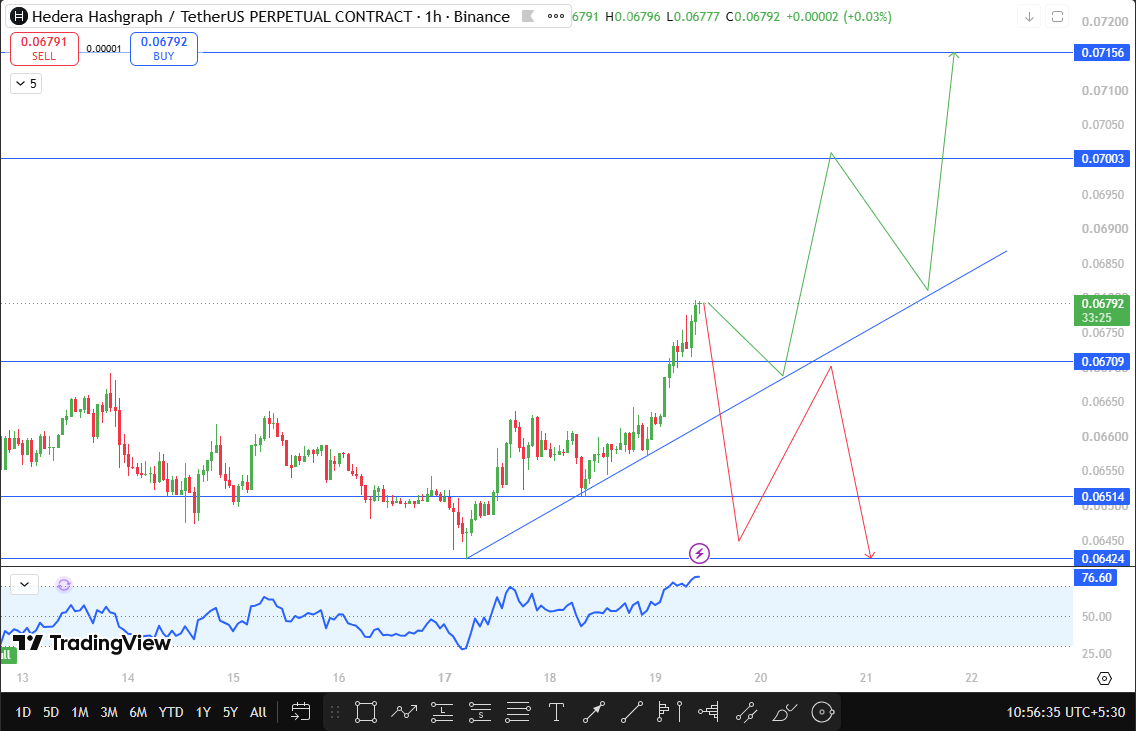
On the 1-hour HBAR/USDT perpetual chart, price has been respecting an ascending trendline since mid-August.
The first retest of this trendline produced a new higher high alongside an aggressive upward move, a combination that points to strong buying interest defending the line rather than a weak, low-conviction bounce.
The chart's momentum indicator is currently reading near 76.60, firmly in elevated territory, reflecting the strength of the recent push higher and supporting the idea that buyers remain in control for now.
If price takes support from the trendline and sustains above 0.06709, the setup favors continuation, with 0.07003 as the first resistance and 0.07156 as the next target on a stronger move.
On the other hand, an aggressive break that closes below 0.06514 would shift the near-term bias, opening the door toward 0.06424 as the next support.
HBAR Technical Outlook Snapshot
Indicator | Signal |
Trend structure | Ascending trendline, confirmed by aggressive higher high on first retest |
Current position | Testing trendline support near 0.06709 |
Momentum reading | Near 76.60, elevated and bullish leaning |
Bias above 0.06709 | Bullish continuation toward 0.07003 and 0.07156 |
Bias below 0.06514 close | Bearish shift toward 0.06424 |
HBAR Support and Resistance Levels to Watch
Type | Level | Note | % From CMP |
Resistance 2 | 0.07156 | Extended breakout target | +5.36% |
Resistance 1 | 0.07003 | First resistance on breakout | +3.11% |
Trendline / Pivot | 0.06709 | Must hold for bullish case | -1.22% |
Breakdown Confirmation | 0.06514 | Aggressive close below confirms shift. | -4.09% |
Support 1 | 0.06424 | Next support on confirmed breakdown | -5.42% |
HBAR Risk-Reward Table
Case | Trigger | Target |
Bull Case | Trendline support holds, sustaining above 0.06709. | 0.07003, then 0.07156 |
Bear Case | Aggressive break, close below 0.06514 | 0.06424 |
Invalidation Level: The bullish structure is invalidated on an aggressive confirmed close below 0.06514, which would shift the near-term bias to bearish and put 0.06424 in focus.
What Would Change This Hedera Price Prediction?
A sustained hold above 0.06709 followed by a push through 0.07003 would strengthen the bullish case and put 0.07156 back on the table, especially if rising network transaction counts continue alongside it.
Conversely, a sharp break below 0.06514 with rising short-term long-side liquidations would add weight to a bearish resolution.
How Bitcoin Sentiment Could Move HBAR
HBAR tends to track broader crypto risk sentiment, with Bitcoin often setting the overall tone for altcoin appetite.
A stable or strengthening Bitcoin tends to support continuation setups like the current HBAR trendline hold, while renewed Bitcoin weakness or a broader risk-off shift could pressure HBAR even before its own key levels are tested.
When This Hedera Price Prediction Gets Revisited
This setup will be revisited if Price closes decisively above 0.07003 or below 0.06514 within the next 24 hours, since either close would confirm the next directional phase.
Absent a confirmed close in either direction, the trendline support level remains the one to watch.
Glossary
CMP: Current Market Price, the live trading price at the time of writing.
Open Interest: The total value of all outstanding futures or perpetual contracts that have not been closed or settled.
Liquidation: The forced closing of a leveraged position when losses erode the trader's margin below the required maintenance level.
Perpetual Futures: A derivatives contract with no expiry date, allowing traders to hold leveraged long or short exposure indefinitely.
Ascending Trendline: A rising line connecting a series of higher lows, used to identify an uptrend and potential support.
Momentum Indicator: An oscillator that measures the speed and strength of recent price moves, often used to spot divergence from price action.
Bull, Base, and Bear Case for HBAR
Bull Case: Price holds the 0.06709 trendline support, confirms with a sustained move above it, and extends toward 0.07003 and eventually 0.07156 as buyers stay in control.
Base Case: Price consolidates around the 0.06709 trendline zone without a decisive close in either direction, with elevated momentum keeping the broader bias tilted bullish.
Bear Case: Price breaks the trendline aggressively, closes below 0.06514, and shifts the near-term bias to bearish, opening a path toward 0.06424.
Disclaimer
This article is for informational purposes only and does not constitute financial advice. Cryptocurrency markets, including perpetual futures, are highly volatile,ac and leveraged trading carries significant risk of loss. CoinGabbar and the analyst do not hold a position at the time of publication. Readers should conduct their own research before making any investment decisions.







.webp)








