Apple Earnings Preview: AAPL Price Prediction After $5T Market Cap


Apple Earnings season has arrived, and this one comes with extra weight. AAPL briefly touched a $5 trillion market cap this week, and Thursday's report will be Tim Cook's final call as CEO.
Shares closed at $340.08 on Tuesday, up 0.94% on the day, after touching an all-time high of $342.89 during the session.
Apple is now only the second company ever to reach a $5 trillion valuation. Nvidia got there first, in October 2025.
Quick Stats
Metric | Value |
Last Close (Tue) | $340.08 (+0.94%) |
Intraday High | $342.89 (52-week high) |
Peak Market Cap | ~$5.036 trillion |
RSI (14-day) | 68.90 |
20 / 50 / 100 / 200-day EMA | $321.52 / $307.79 / $294.19 / $277.61 |
Next Earnings | Thursday, July 30, 2026, after market close |
What Happened to Apple Stock This Week?
AAPL jumped nearly 2% on Tuesday, briefly pushing Apple's market cap to about $5.036 trillion. Shares slipped back into the close, ending near $4.99 trillion in value.
On Monday, Apple passed Nvidia to reclaim the title of the world's largest public company, a lead it held into Tuesday's close, about 6% ahead of Nvidia by market value.
When Is Apple's Q3 2026 Earnings Date?
Apple reports fiscal Q3 2026 results this Thursday, July 30, after the market closes. The call starts at 5:00 PM EDT, and it will be Tim Cook's last as CEO before John Ternus takes over on September 1.
Heading into the report, $AAPL traded near $339 to $340 in Wednesday's pre-market session, just under Tuesday's close.
What Does Wall Street Expect From Apple Earnings?
Last quarter, the stock beat forecasts across the board, posting $111.2 billion in revenue, up 16.6% from a year ago.
For this quarter, Wall Street expects revenue near $108.9 billion, with earnings per share around $1.89, up roughly 20% year over year.
Apple has kept AI spending light compared with rivals like Microsoft and Amazon, leaning on Google's Gemini to power a revamped Siri arriving this fall alongside the iPhone 18 lineup and Apple's first foldable phone.
Apple is also rolling out Apple Upgrade, a Klarna-backed leasing plan for iPhone, Watch, Mac, and iPad.
What Do AAPL's Technical Indicators Show?
The daily chart printed a Doji candle right near record highs. A Doji shows buyers and sellers are evenly matched. It does not confirm a reversal by itself, but it often means traders are waiting on a fresh catalyst before pushing the stock further.
The stock is trading above its 20-day, 50-day, 100-day, and 200-day EMAs, a classic sign of an uptrend.
The Relative Strength Index sits near 69. Readings above 70 usually mean overbought. $AAPL is not there yet, but it is close.
What Are AAPL's Key Support and Resistance Levels?
Zone | Price | What It Means |
Extended Target | ~$362 | 1.618 Fibonacci extension |
Breakout Zone | ~$334 to $335 | Old resistance, now a support test |
Current Price | $340.08 | Tuesday's close |
Support 1 | ~$322 | First pullback zone |
Support 2 | ~$308 | Secondary support |
Support 3 | ~$290 | Deeper support if selling builds |
If AAPL holds the $334 to $335 zone as support, the next stop is the 1.618 extension near $362.
If Earnings triggers profit-taking instead, the first level to watch sits near $322, followed by $308 and $290.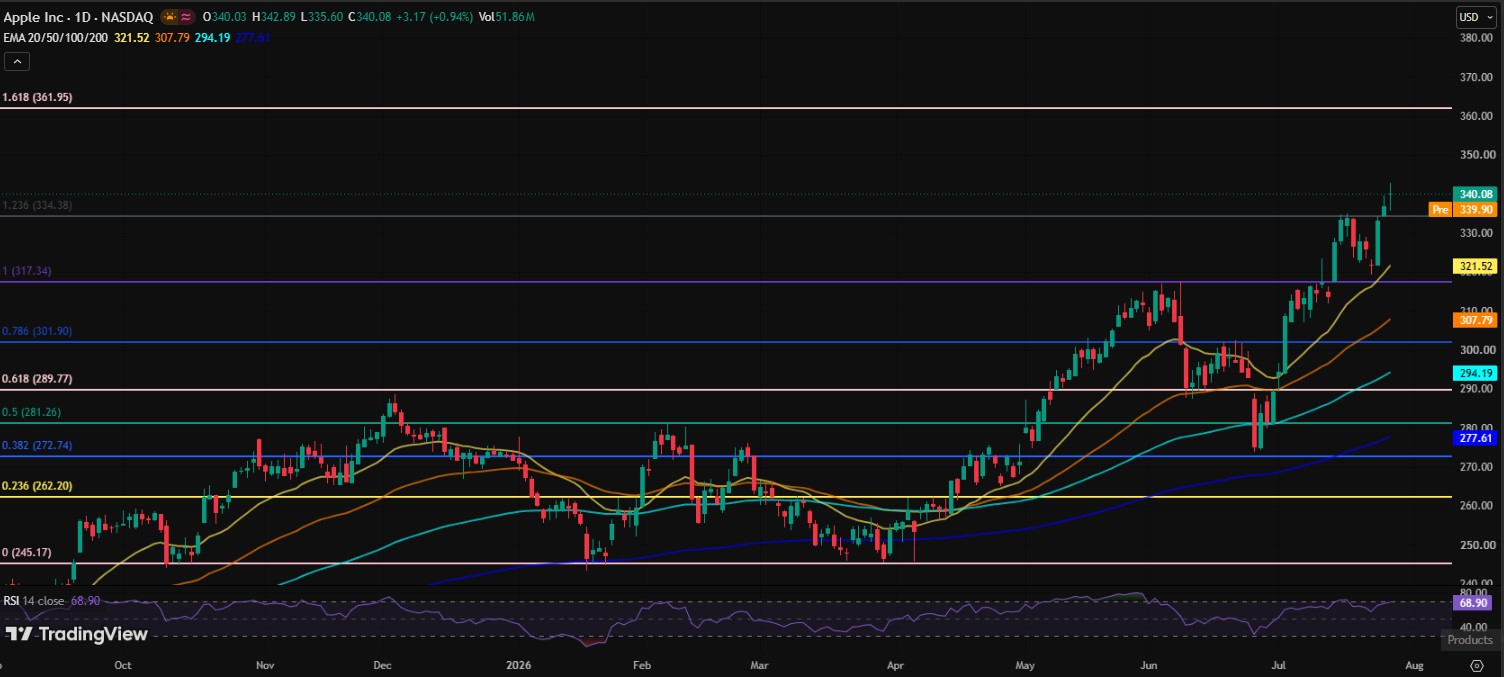
How Are AAPL Perpetual Traders Positioned?
Crypto exchanges also list AAPL perpetual contracts, and that data adds another layer to the picture.
The AAPL perpetual traded near $339.74 heading into Wednesday, with Binance and tradeXYZ handling the bulk of the volume, followed by Bybit, OKX, and Bitget.
As per CoinGlass data, Short sellers have taken the hit lately. Over the past 24 hours, liquidations totaled about $1.39 million, and nearly all of it came from short positions getting closed out.
Positioning is mixed across exchanges. Binance accounts lean slightly short, while OKX accounts lean slightly long, and Binance's top traders skew even more short, leaving room for a squeeze if the rally continues.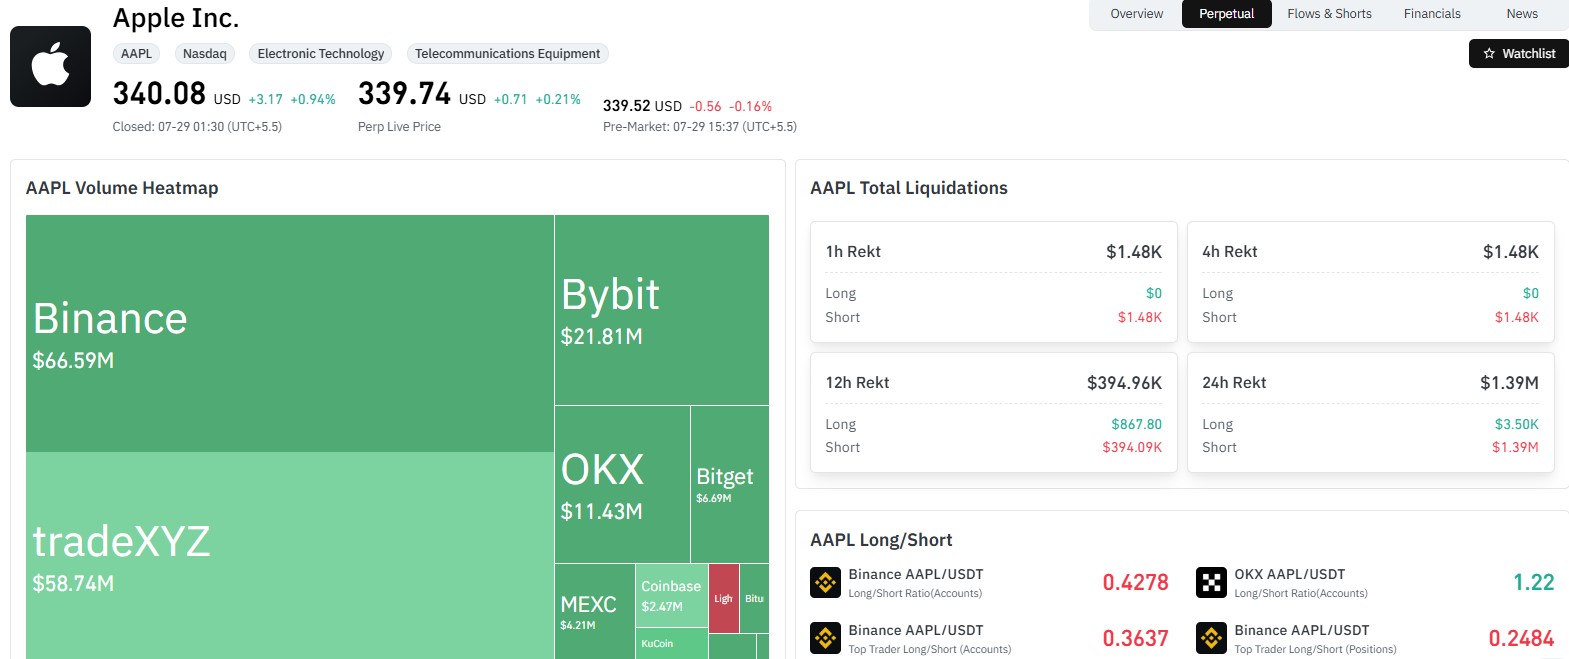
Apple Earnings Price Prediction: What Could Happen Next
Nobody can say for certain where AAPL heads next, especially with a new CEO taking the wheel in September. But the setup points to a few scenarios worth watching.
Bullish case: AAPL holds support near $334 to $335. Buyers stay in control, and the stock works toward $362.
Bearish case: Guidance disappoints, and AAPL slips back under $335. A deeper pullback could test $322, then $308 or $290.
Neutral case: The Doji pattern plays out as expected, and AAPL chops sideways until the earnings call gives traders a clearer signal.
Disclaimer
This article is for information only. It is not financial advice or a recommendation to buy or sell any asset. Do your own research and speak with a licensed financial advisor before making investment decisions. Past performance does not guarantee future results.









.jpg)








