Pi Network Price Prediction: Can This Breakout Send $PI Toward $2?


PI just pushed out of a range it had been stuck in for a while.
That's the headline for this pi network price prediction right now.
Worth remembering, PI spent years as a mobile mining app before its open mainnet finally went live in February 2025, and the price has traded well below its early post-launch highs ever since. Right now $PI sits at $0.08593.
The bigger picture chart shows the same tug of war playing out on a larger scale, so the next few candles matter more than usual here.
Live Market Data
$PI is trading around $0.08593, up 3.2% over the past day, with the 24-hour range stretching from $0.0824 to $0.0862.
Market cap sits at $945.26 million, with a fully diluted valuation of $1.454 billion given the token's larger total supply. 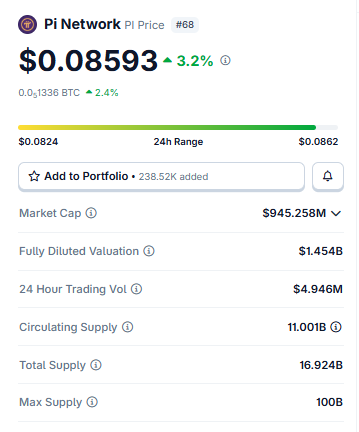
Source: $PI Market Cap Data Taken From Coingecko, data as of Aug 05, 2026. Figures may vary slightly across other tracking websites.
24-hour trading volume comes in at $4.95 million, on the lighter side compared to the market cap.
Circulating supply: 11 billion tokens, out of a 100 billion max supply, a gap worth keeping in mind for any long-range price target discussion.
Social Sentiment of $PI
The team behind that partnership described the goal as connecting humans, AI agents, and robots through one shared payment layer.
Letting physical services like delivery or security patrols become something people simply request on demand rather than something they own outright. 
Source: Data Taken From @FabricFND , X Account.
They framed it as building toward a broader machine economy running alongside the human one.
Ambitious framing and worth watching, but it's still early days for how much of that actually gets built and used.
Key Takeaways
-
PI is trading near $0.08593, up 3.2% on the day, after pushing out of an ascending channel on the hourly chart.
-
The daily chart shows the same setup, price pressing against the top of its own ascending channel.
-
Hold this breakout, and $0.08698 comes first, with $0.08806 as the next stretch target.
-
A failed breakout instead drags PI back to $0.08276, then $0.08187.
-
Zoom out to the daily chart, and the bigger targets sit at $0.10382 and $0.12949, with support at $0.07815 and $0.07045 if this move fails.
Hourly Chart: Ascending Channel Breakout
On the 1H chart, PI has already staged a breakout from its own ascending channel, and price is now deciding what to do with that move.
The jump came on a clear volume spike, which is usually a better sign than a breakout that drifts out on quiet trading. 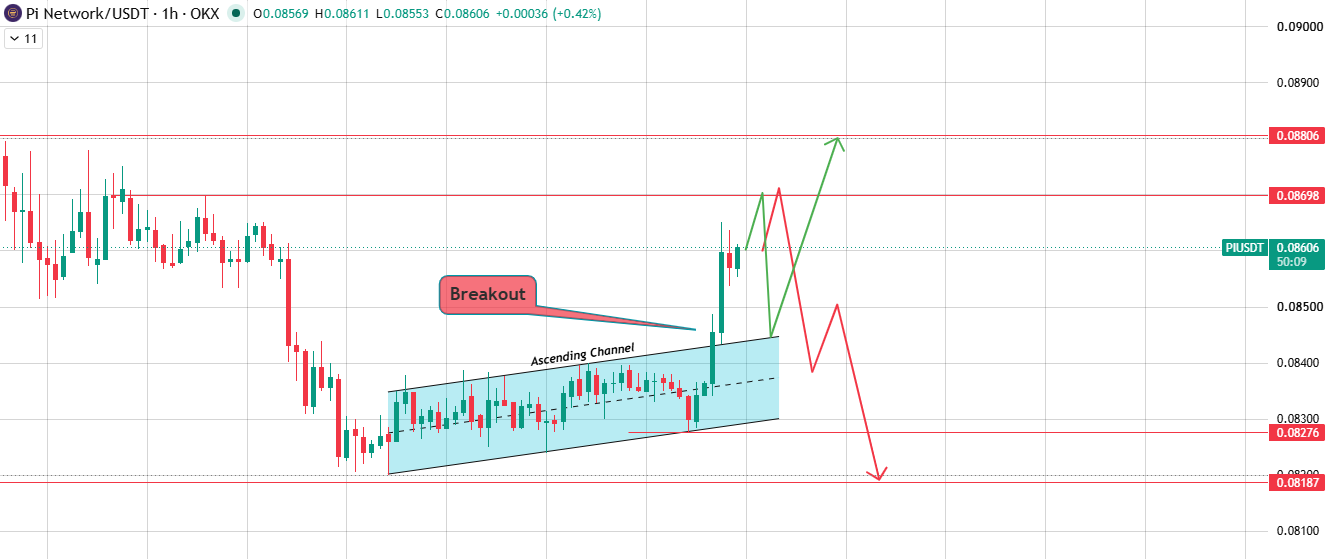
Source: Chart Taken From TradingView.
Hold above the breakout zone, and $0.08698 is the near-term resistance level, stretching to $0.08806 if momentum keeps building.
Fail to hold it, and $PI could slip back through the support zone at $0.08276, with $0.08187 as the next level down if sellers take over.
Daily Chart: Ascending Channel
$PI has spent weeks climbing inside an ascending channel on the 1D timeframe, and the price is going to test the upper boundary of that structure.
RSI on this timeframe sits around 44.60, which leaves plenty of room before anything looks stretched. 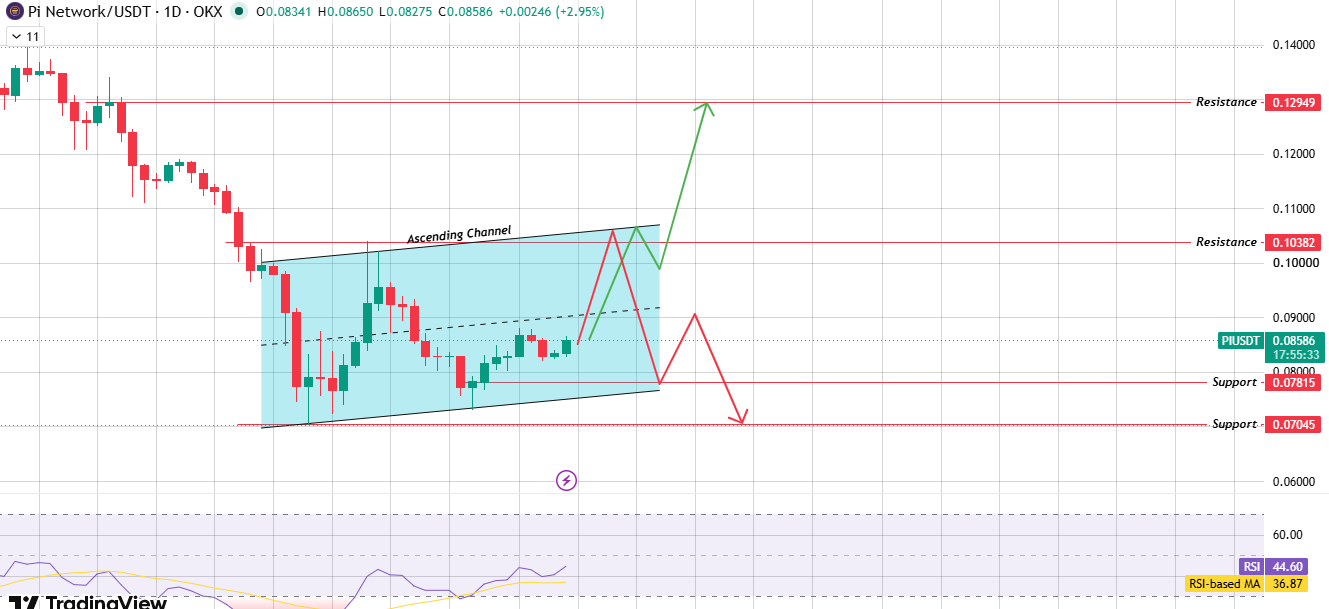
Source: Chart Taken From TradingView.
Clear that boundary with real volume behind it, and a bullish breakout puts $0.10382 in play as the first resistance level, with room to run toward $0.12949 if buyers stay in charge.
That's a big move, so it would take sustained follow-through over several sessions, not just a single green candle.
Get rejected here instead, and the price likely rolls back down through the channel in a bearish breakdown toward the support zone.
First support sits at $0.07815, and a deeper slide could test $0.07045 before buyers get another look.
Bull, Base, and Bear Scenarios
What flips this? The bull case weakens if PI can't hold above $0.08276 on a retest. The bear case weakens if the price reclaims $0.08698 with strong volume behind it.
Catalysts
A fresh partnership announcement is adding some noise to this pi network price prediction beyond the charts.
A Pi-linked ecosystem project revealed a payment integration aimed at letting AI agents and robots pay for services using Pi, framing it as a step toward machines transacting through the same rails people already use.
It's an early-stage, ecosystem-level story rather than something with immediate on-chain volume behind it, but it's the kind of headline that can shift sentiment around a token, at least for a while.
Market Context
$PI still moves within the wider currents of the crypto market, even with its own ecosystem news in play.
When BTC dominance rises, capital tends to rotate away from smaller-cap tokens like PI, which can cap upside even during a clean technical breakout.
Broader risk appetite across crypto, tied closely to how Bitcoin and Ethereum are trading, still sets a ceiling or a floor on how far a move like this one can realistically travel.
PI's ETH correlation through the wider altcoin market adds another factor worth tracking alongside the charts.
Glossary
Ascending Channel: Two upward-sloping lines running in parallel, with price bouncing between them until one side finally gives way.
Breakout: A move where price pushes clear of a range or pattern it had been contained in, often on a jump in volume.
Resistance Level: A price zone where selling has shown up before, making it a spot buyers need to clear to keep pushing higher.
Support Zone: The flip side of resistance, a price area where buyers have stepped in before to stop a decline.
Methodology: This analysis is based on technical chart patterns read from TradingView, along with live market data as of the time of writing. Price levels are derived directly from the charts referenced, with no extrapolation beyond what the structures show.
Disclaimer: This pi network price prediction is for informational purposes only and does not constitute financial advice. Cryptocurrency markets are highly volatile and speculative, and newer tokens like PI can see especially sharp swings. Always conduct independent research and consider your own risk tolerance before making any investment decisions.


















