Pi Network Price Prediction: Could Lockup Data Shape PI's Next Move?


Attention on PI has shifted toward a question that rarely gets asked until a token has been trading a while: how much of its supply is actually free to move. That question shapes this Pi Network price prediction.
Pi Network began in 2019 as a mobile mining project before moving to Open Network, where PI now trades as a fully transferable token, and it currently holds the #71 spot by market cap.
Pi Network price today is $0.09645, down 1.5% over the last 24 hours. Price has ranged between $0.09324 and $0.09853 during this period, and the market cap stands at $1.075B.
Pi Coin Live Market Data
Metric | Value |
Price | $0.09645 |
Market Cap | $1.075B |
Fully Diluted Valuation | $1.653B |
24-Hour Trading Vol | $6.324M |
Circulating Supply | 11.142B |
Total Supply | 17.141B |
Max Supply | 100B |
Pi Network News: Understanding PI's Token Lockups
BSCN Examines How Lockups Shape Circulating Supply
BSCN published a report this week calling Pi Network's native token one of the more interesting, if controversial, assets in crypto and pointed to its lockup structure as a central reason why. 
Source: Data Taken From @BSCNews, X Account, as of Sep 10, 2026
The outlet's core argument is straightforward: tokens that remain locked can't add selling pressure the way freely tradable ones can, so understanding the pace at which $PI unlocks matters for anyone trying to gauge how supply might grow over time.
It's not the kind of detail that moves price in a single session, but it shapes how analysts think about PI's longer-term trajectory.
Pi Network Price Prediction: Technical Outlook
Pull up the daily PI/USDT chart on OKX, and the price is sitting above a rising trendline that's been held since early August. 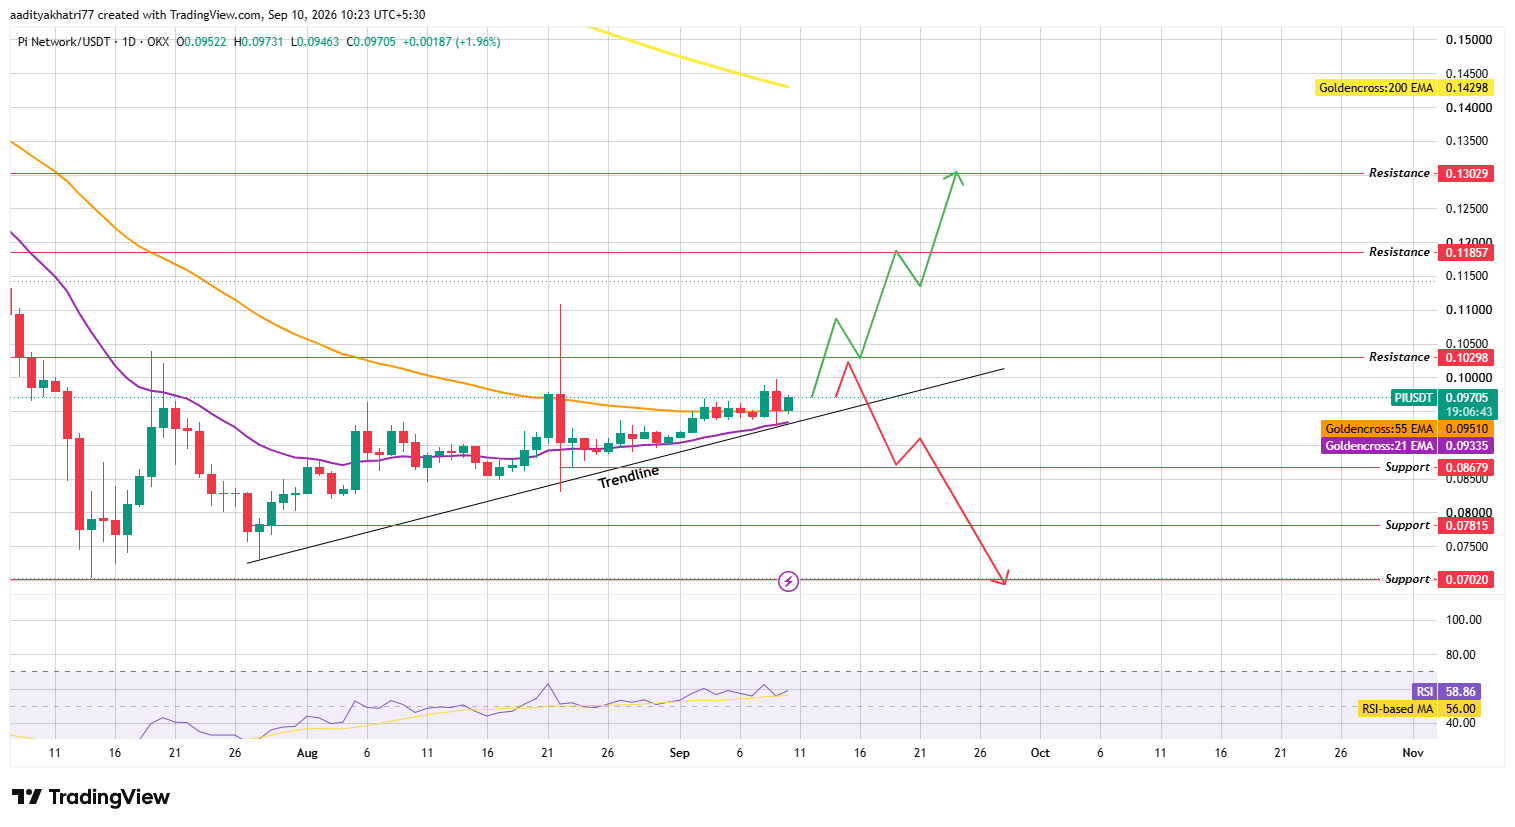
Source: Chart Taken From TradingView, as of Sep 10, 2026
$PI Coin recently found support near $0.0951, bouncing off its 55-day EMA at that level, a bounce that's kept the broader uptrend structure intact.
RSI reads 58.86, above its moving average of 56.00, which points to momentum that's holding up without looking stretched.
Could PI Break Toward Higher Resistance?
A daily close above $0.10298, backed by rising volume, would confirm a breakout from the current range.
Push through that level on continued strength, and $0.11857 comes into view next, with $0.13029 as the following resistance if buying pressure carries further into the month.
What Happens If PI Gets Rejected From Resistance?
Turn the scenario around: a rejection at resistance followed by a break of the rising trendline shifts focus to $0.08679 as the first support.
Lose that level and PI could slide toward $0.07815, with $0.07020 coming into play if the pullback continues.
Support and Resistance Levels
Support | Resistance |
$0.08679 | $0.10298 |
$0.07815 | $0.11857 |
$0.07020 | $0.13029 |
EMA | Level |
21 EMA | $0.09335 |
55 EMA | $0.09510 |
200 EMA | $0.14298 |
Scenario | Setup | Level |
Bull | Daily close above resistance on rising volume | $0.10298–$0.13029 |
Base | Price consolidates near the 21 and 55 EMAs. | $0.093–$0.100 |
Bear | Rejection from resistance, break of rising trendline | $0.08679–$0.07020 |
PI vs Bitcoin
PI still mostly moves with the broader crypto market rather than on its own script.
When Bitcoin trades with more conviction, the breakout and rejection scenarios above tend to play out with more force in either direction, a reminder that a token at PI's liquidity level remains closely tied to overall market sentiment.
Expert Opinion
Traders watching PI's setup tend to read a bounce off the 55 EMA inside an established uptrend as constructive, so long as the rising trendline underneath keeps holding.
Where the lockup story fits in is a bit different; most treat it as a medium-term supply factor rather than something that explains today's price action, since tokens still under lockup don't directly influence a breakout or breakdown the way active trading volume does.
Disclaimer: This Pi Network price prediction is for informational purposes only and should not be treated as financial advice. Cryptocurrency markets are highly volatile, technical patterns can fail to play out as expected, and any of the scenarios described above carry a realistic probability of not occurring. Readers should conduct independent research before making any investment decisions.

















