Pi Network Price Prediction: Can Pi Coin Bounce Back from 55 EMA?


Pi Network price prediction comes down to a fairly simple question right now: does support hold, or does it give way?
Pi Network built its early reputation on mobile mining and one of the largest pre-launch communities in crypto, and that base has stuck around well past the token's exchange debut.
$PI is currently trading at $0.09443, down 0.9% on the day, as price drifts toward the lower boundary of the ascending channel it has been climbing inside on the 4-hour chart.
Pi Network Live Market Data
Metric | Value |
Price | $0.09443 |
24h Change | -0.9% |
24h Range | $0.09409 - $0.09569 |
Market Cap | $1.052B |
Fully Diluted Valuation | $1.619B |
24h Trading Volume | $3.563M |
Circulating Supply | 11.142B |
Total Supply | 17.141B |
Max Supply | 100B |
Source: PI market data as of Sep 07, 2026. Figures may vary slightly across other tracking websites.
Pi Network Coin News
Sentiment among $PI holders is holding up despite the pullback toward support.
One crypto media account posted a short, confident message telling followers it would not be selling, adding that it expects to see the token trading higher down the line.
Source: Data Taken From @Web3news_Org, X Account.
That kind of hold-steady messaging tends to show up whenever a token dips toward a key level, and it lines up with how $PI has behaved at support so far this cycle, drawing buyers back in rather than triggering a deeper sell-off.
Pi Network Price Prediction Outlook: Technical Analysis
The 4-hour PI/USDT chart on OKX shows price climbing inside a clean ascending channel since late August, with the current candle drifting down toward the channel's lower boundary and the 55 EMA.
Price has bounced off this same channel structure twice already on this move, both times reversing sharply higher on stronger volume.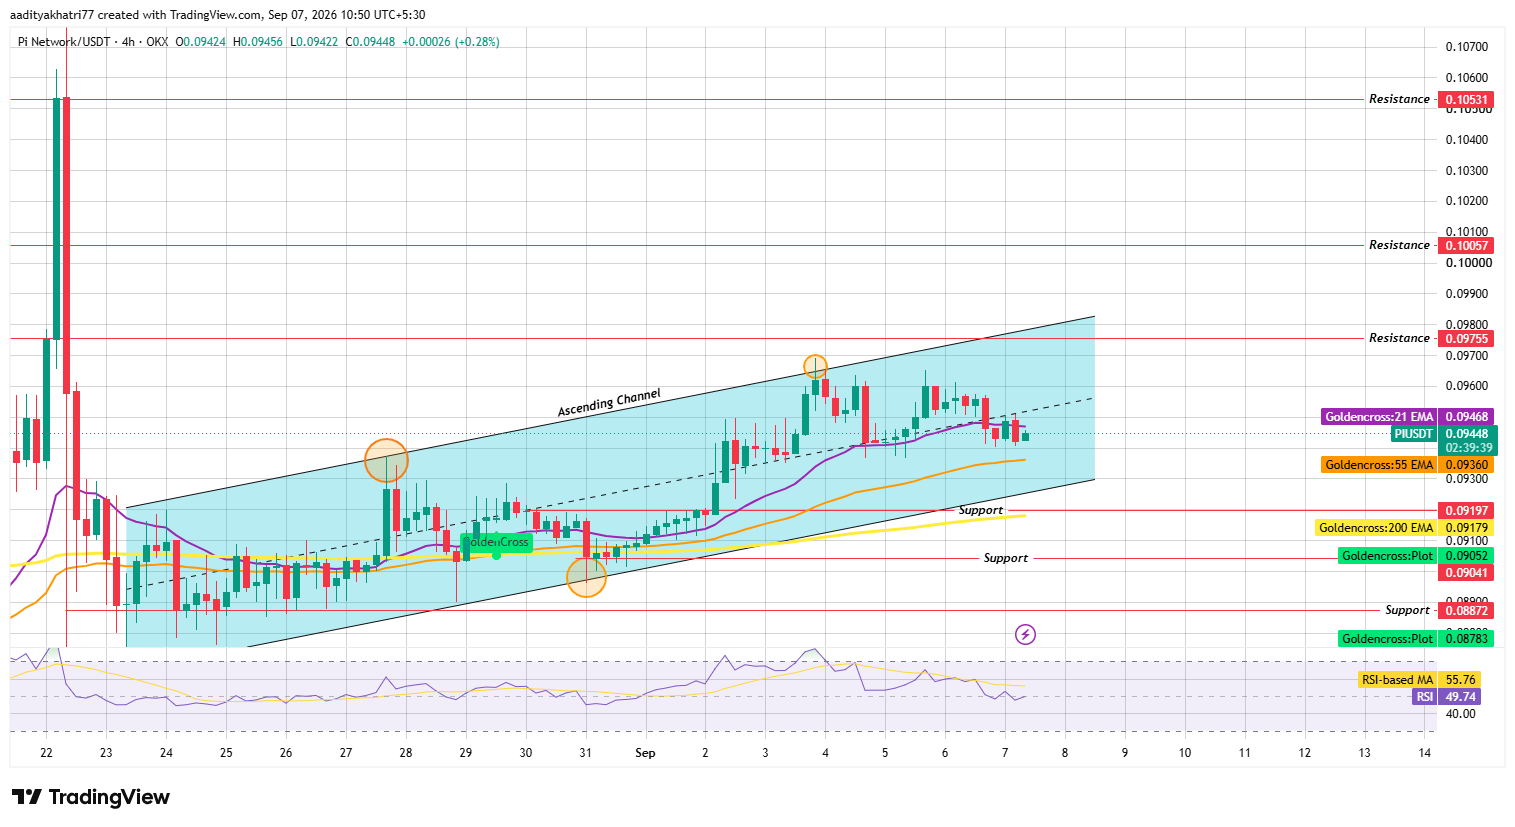
Source: Chart taken from TradingView , OKX PI/USDT pair, as of Sep 07, 2026, 10:50 UTC+5:30.
Can $PI Bounce Off Channel Support?
If history inside this channel repeats, a bounce here would need buyers to step in near the $0.09197 support zone with volume picking back up, similar to the last two tests.
Hold that level, and a move back toward $0.09755 becomes the near-term target, with $0.10057 next if the channel's upper boundary breaks on a confirmed close.
What Happens If $PI Breaks Below Support?
A confirmed 4-hour close below $0.09197 would put the ascending channel structure at risk and open the door to $0.08872.
That would mark the first real break of the pattern that has held since late August, so it's the level worth watching most closely from here.
RSI is sitting at 49.74, just under its moving average of 55.76. That gap points to momentum leaning slightly soft right now, consistent with price testing support rather than pushing toward resistance.
Support and Resistance Levels (4H Chart)
Level Type | Price |
Resistance 3 | $0.10531 |
Resistance 2 | $0.10057 |
Resistance 1 | $0.09755 |
Support 1 | $0.09197 |
Support 2 | $0.08872 |
EMA Levels (4H Chart)
EMA | Price |
21 EMA | $0.09468 |
55 EMA | $0.09360 |
200 EMA | $0.09179 |
Pi Network Price Prediction: Bull, Base, and Bear Scenarios
Scenario | Setup | Level |
Bull Case | Support holds near the 55 EMA, and channel resistance clears on volume. | $0.09755, then $0.10057 |
Base Case | Price chops between channel support and resistance without a clear break | Range-bound between $0.09197 and $0.09755 |
Bear Case | Confirmed close below channel support | $0.08872 |
Glossary
An ascending channel is two upward-sloping trendlines running in parallel, with price bouncing between them until it eventually breaks one way or the other.
$PI has respected this same channel twice already on the current move, which is part of why the current test matters.
The 55 EMA gets mentioned a lot here because it's sitting almost exactly where the channel's lower boundary currently sits, so a bounce or a breakdown at one level tends to confirm the other.
RSI is just a momentum gauge, scored 0 to 100, used to flag when a move has run too far too fast in either direction.
Right now it's sitting below its own moving average, which usually just means momentum is cooling rather than reversing outright.
Pi Network vs Bitcoin
$PI's channel test looks driven mostly by its own chart structure and community sentiment rather than anything specific happening with Bitcoin at the moment.
Still, $PI tends to lose some of its independence during sharp Bitcoin moves, so a steady or rising Bitcoin probably makes it easier for buyers to defend support here.
A hard Bitcoin price today drop would make that same bounce a lot tougher to pull off.
Expert Opinion
Traders watching this setup point out that $PI bouncing off the same channel structure twice already is a decent sign the pattern still has buyers behind it.
What makes this test a bit different is that price is now sitting almost exactly at the 55 EMA and the channel boundary at the same time, so whichever way this breaks is likely to be a clean, fairly decisive move rather than a slow grind.
Disclaimer: This Pi Network price prediction is based on technical chart analysis and current market data and should not be treated as financial advice. Cryptocurrency markets are highly volatile, and actual price movements may deviate significantly from projected scenarios. Support and resistance levels discussed represent probability zones, not guaranteed outcomes, and downside risk exists at every stage of this analysis. Readers should conduct independent research before making investment decisions.
Also read:

















