Pi Network Price Prediction: Pi Coin Tests $0.095 as MiCA News Breaks


Pi Network price prediction searches usually start with the project's background. Pi Network began as a mobile mining app in 2019, letting users earn PI tokens through their phones before the network's mainnet launched.
It has since grown into one of the more widely tracked newer cryptocurrencies, currently ranked #70 by market capitalization. $PI currently trades at $0.0949, up 0.5% over the past 24 hours.
That puts Pi Network's market capitalization at $1.058 billion, with a circulating supply of roughly 11.14 billion tokens out of a 100 billion max supply.
Pi Network Coin Live Market Data
Metric | Value |
Price | $0.0949 |
24h Change | +0.5% |
24h Range | $0.0937 – $0.09679 |
Market Cap | $1.058B |
Fully Diluted Valuation | $1.627B |
24h Trading Volume | $5.914M |
Circulating Supply | 11.142B |
Total Supply | 17.141B |
Max Supply | 100B |
Source: Pi Network coin market cap data taken from CoinGecko, data as of Sep 04, 2026. Figures may vary slightly across other tracking websites.
Pi Network News
Pi Network Alerts (@PiNetworkAlerts): $PI filed its MiCA white paper in 2025, and ESMA registered it in early 2026.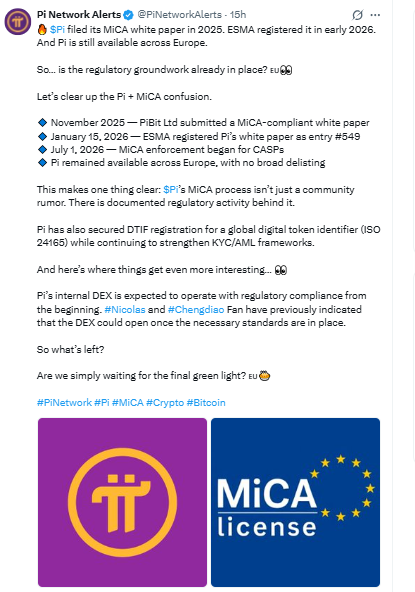
Source: Data Taken From @PiNetworkAlerts, X Account, As of Sep 04, 2026
Why it matters: The thread lays out a regulatory timeline for Pi in Europe. PiBit Ltd submitted a MiCA-compliant white paper in November 2025. ESMA registered Pi's white paper as entry #549 on January 15, 2026.
MiCA enforcement for crypto-asset service providers began on July 1, 2026, and $PI has remained available across Europe without a broad delisting.
The project has also secured DTIF registration for a global digital token identifier under ISO 24165, alongside ongoing work on KYC and AML frameworks.
Internal DEX is expected to launch with regulatory compliance built in from the start.This kind of regulatory groundwork tends to matter more for long-term positioning than for short-term price swings, but it does reduce one source of uncertainty around Pi's availability in a major market like Europe.
Pi Network Price Prediction Forecast: Technical Analysis
The daily chart on OKX shows price consolidating inside an ascending triangle, built from a rising trendline support and a flat resistance line formed by a series of similar swing highs. 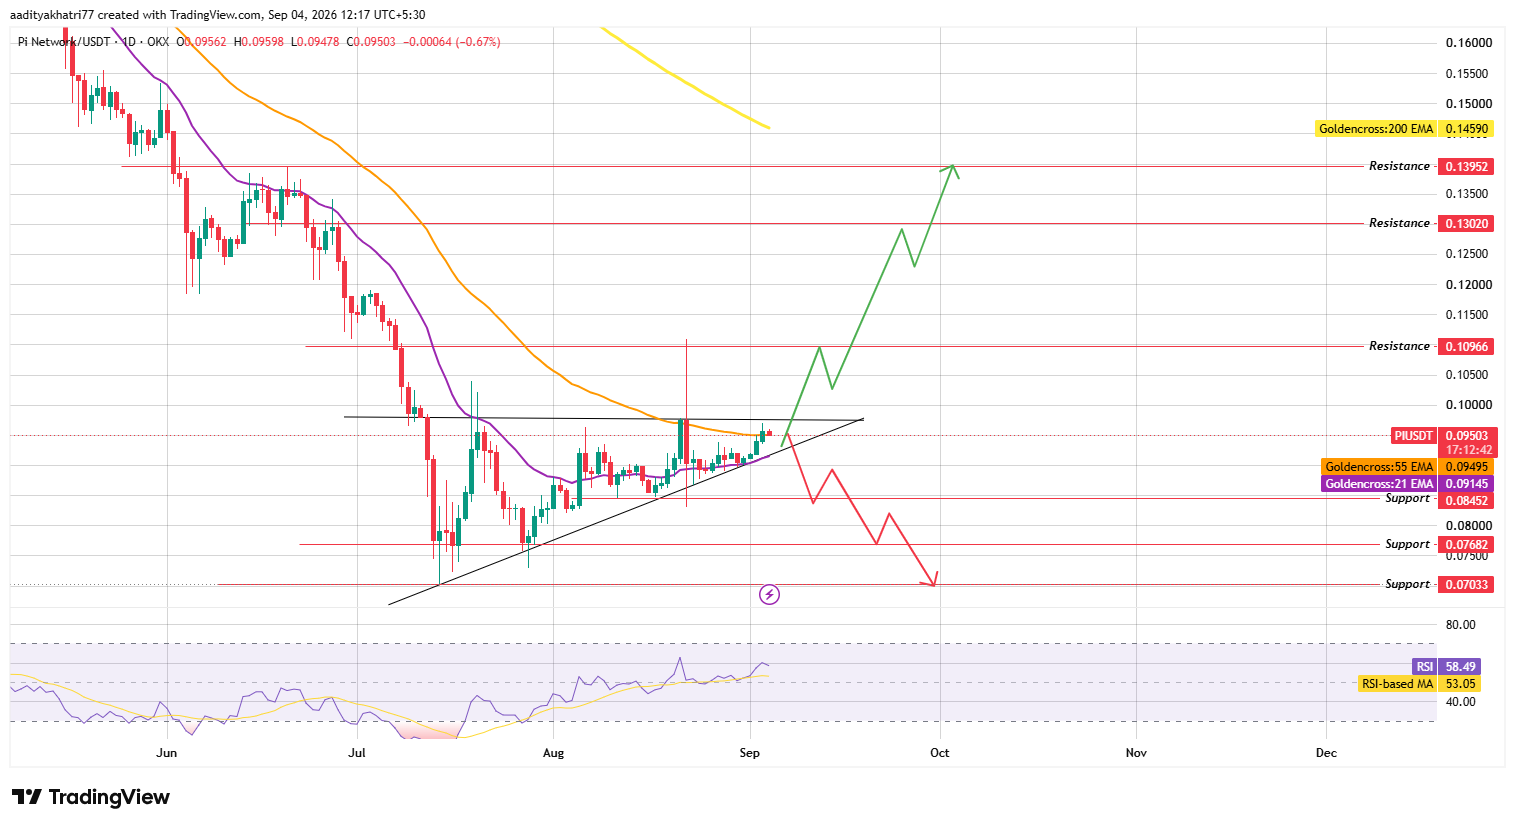
Source: Chart Taken From TradingView, As of Sep 4, 2026
This structure has been developing since around July, following a sharp decline in May and June.
Can $PI Break Above the Triangle's Upper Boundary?
Price is currently testing the 55 EMA at $0.09495, sitting just above it on the daily candle.
A move higher that clears this level on rising volume would set up a test of the triangle's flat upper boundary.
A confirmed breakout above that boundary, backed by strong volume, would open the path toward $0.10966, then $0.13020, and eventually $0.13952.
What Happens If $PI Breaks the Rising Trendline Support?
If $PI fails to hold the 55 EMA and slips back toward the triangle's rising trendline, a break below that support line would shift the outlook bearish.
That would bring $0.08452 into focus first, with continued weakness risking a slide toward $0.07682 and, further out, $0.07033.
The RSI reading of 58.49, with its moving average at 53.05, shows momentum leaning mildly toward buyers without being stretched.
This leaves room for either a breakout attempt or a pullback within the triangle before the next clear directional move.
Pi Network Support and Resistance Levels (Daily Chart)
Level Type | Price |
Resistance 3 | $0.13952 |
Resistance 2 | $0.13020 |
Resistance 1 | $0.10966 |
Support 1 | $0.08452 |
Support 2 | $0.07682 |
Support 3 | $0.07033 |
Pi Network EMA Levels (Daily Chart)
EMA | Value | Price Position |
21 EMA | $0.09145 | Price trading above |
55 EMA | $0.09495 | Price testing this level |
200 EMA | $0.14590 | Price trading below |
Pi Network Price Prediction: Bull, Base, and Bear Scenarios
Scenario | Setup | Level |
Bull Case | Break above the ascending triangle's upper boundary with strong volume. | $0.10966, extended levels $0.13020 and $0.13952 |
Base Case | Price continues coiling inside the ascending triangle, testing the 55 EMA. | Range-bound trade near current levels |
Bear Case | Break below the triangle's rising trendline support. | $0.08452, deeper breakdown toward $0.07682 and $0.07033 |
Glossary
Ascending Triangle: A chart pattern formed by a rising trendline support and a flat horizontal resistance line, generally viewed as a continuation pattern within an uptrend once price breaks above the flat boundary.
EMA (Exponential Moving Average): A moving average that weights recent price data more heavily than older data, making it react faster to fresh price action than a simple moving average.
RSI (Relative Strength Index): A momentum indicator ranging from 0 to 100 that measures how fast and how far price has moved recently, often used to gauge overbought or oversold conditions.
MiCA: The Markets in Crypto-Assets regulation, the European Union's framework for licensing and overseeing crypto-asset service providers and token issuers.
Support Zone: A price area where buying interest has previously been strong enough to slow or reverse a decline.
Resistance Zone: A price area where selling pressure has previously been strong enough to slow or reverse an advance.
Pi Network vs Bitcoin
Pi Coin's recent price action has shown some independence from Bitcoin, with the ascending triangle forming largely on Pi-specific catalysts such as regulatory updates rather than tracking Bitcoin's move.
Bitcoin price today sits near $81,000, and while Bitcoin's broader direction still shapes overall risk appetite across crypto, $PI's smaller size and newer listing status mean project-specific news, like the MiCA compliance timeline, can carry more weight day to day.
A stable or rising Bitcoin price prediction would still make PI's breakout attempt easier, while a sharp Bitcoin downturn could pressure $PI's support levels regardless of its own technical setup.
Expert Opinion
Market commentary around $PI Network has increasingly focused on the project's regulatory standing in Europe, given how few newer tokens have documented MiCA-related activity this early.
Analysts tracking the project note that continued availability across EU exchanges, combined with DTIF registration, suggests $PI's team is treating compliance as a priority rather than an afterthought.
On the chart, near-term direction is still expected to hinge on whether $PI can hold the 55 EMA and break above the ascending triangle's resistance on strong volume.
Disclaimer: This article is for informational purposes only and does not constitute financial advice. Cryptocurrency markets, including Pi Network , are highly volatile, and prices can move sharply in either direction within short periods. The bull, base, and bear scenarios outlined above are technical projections based on available chart data and are not guarantees of future performance. There is a realistic possibility that PI could fail to reach any of the stated levels or could decline well below the support levels discussed, including in the event of broader market downturns or shifts in regulatory sentiment. Readers should conduct their own research and consult a qualified financial advisor before making investment decisions.
















