Pi Network Price Prediction: Did Elon Musk Just Move The Market?


This Pi Network Price Prediction starts with where things stand: PI, the mobile-mined token that built a large grassroots community before its mainnet listing, is currently trading around $0.09144 today, up slightly on the day.
It continues to draw attention from a sizable retail base watching for its next directional move.
Live Market Data
Metric | Value |
Price | $0.09144 |
24h Change | +0.8% |
24h Range | $0.09016 - $0.09155 |
Market Cap | $1.018B |
Fully Diluted Valuation | $1.566B |
24h Trading Volume | $2.754M |
Circulating Supply | 11.138B |
Total Supply | 17.135B |
Max Supply | 100B |
Source: $PI market cap data taken from CoinGecko, data as of Sep 01, 2026. Figures may vary slightly across other tracking websites.
Pi Network News Today
A casual social media exchange has stirred up unexpected buzz in the Pi Network community. Elon Musk responded to a user's comment referencing Pi's symbol, and while the reply itself was brief, some Pioneers have read it as a form of endorsement. 
Source: Data Taken From @BSCNews, X Account.
Others are more cautious, pointing out that PI's price hasn't moved meaningfully despite the attention the exchange generated online.
Key Takeaways
PI is trading around $0.09144, sitting above its rising trendline and boxed inside a tight consolidation range on the 4-hour chart.
A breakout above the consolidation box could send price toward $0.09768, then $0.10214, and $0.11085.
Rejection at resistance followed by a trendline break risks a slide toward $0.08432 and $0.07446.
RSI reads 54.43, mildly above the RSI-based moving average of 49.88, hinting at a slight bullish tilt.
Chatter around an Elon Musk reply touching on Pi's community has stirred discussion, though price action hasn't reacted much yet.
Technical Analysis
Trendline Still Holding
PI has been climbing along a rising trendline on the 4-hour chart since its recent lows, and that line is still intact. 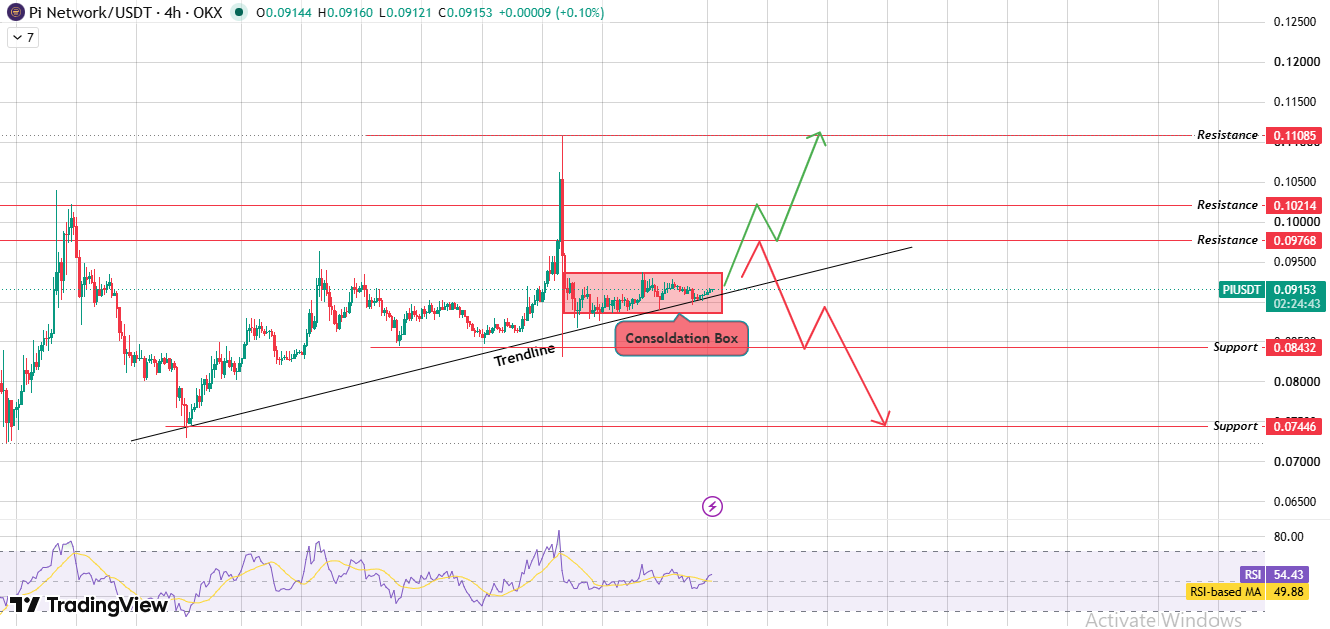
Source: Chart Taken From TradingView.
Every dip so far has found buyers stepping in right around it, which keeps the broader structure leaning constructive as long as price stays above it.
Boxed Inside Consolidation
Since the last sharp rally, $PI has settled into a tight consolidation box just above the trendline. Price has been chopping sideways inside this range for a while now, effectively pausing to digest the previous move before committing to a direction.
This kind of squeeze, sitting on top of an active trendline, is often the setup right before a bigger swing.
Momentum Check
RSI sits at 54.43, just above its own moving average of 49.88. Nothing extreme here, but the slight edge above the average lines up with the mild upward drift seen in recent candles rather than any loss of steam.
If the Box Breaks Higher
A confirmed move above the consolidation box's upper boundary, ideally on rising volume, opens the path toward $0.09768 first.
Clearing that puts $0.10214 in view, with $0.11085 as the stretch target if momentum carries through.
If Sellers Take Control
Should PI get turned away at resistance and then lose the rising trendline underneath it, that combination would mark a shift in structure.
In that case, $0.08432 becomes the first support to watch, with $0.07446 as the deeper level below it.
Support & Resistance Levels
Type | Level |
Resistance 3 | $0.11085 |
Resistance 2 | $0.10214 |
Resistance 1 | $0.09768 |
Support 1 | Rising Trendline |
Support 2 | $0.08432 |
Support 3 | $0.07446 |
Bull, Base & Bear Case
Scenario | Target Levels | Trigger | Invalidation |
Bull Case | $0.09768 $0.10214 $0.11085 | Break above the consolidation box with volume. | Close back below the rising trendline. |
Base Case | $0.08600 - $0.09768 range | Price stays boxed in consolidation, holding above the trendline. | Break of either the box or the trendline |
Bear Case | $0.08432 $0.07446 | Rejection at resistance followed by a trendline breakdown | Reclaim of $0.09768 on volume |
Note: All levels are chart-derived from the 4-hour PI/USDT timeframe. This is not financial advice.
Expert Opinion
The general reading among market watchers is that this kind of social media moment tends to boost sentiment and search interest far more than it moves actual price.
A reply mentioning a token's symbol isn't the same as an endorsement of the project itself, and observers note that PI's muted price reaction so far backs that view.
Most chart-focused traders are still treating the consolidation box and trendline as the levels that will actually determine where PI heads next, independent of the social chatter.
Glossary
Consolidation Box: A defined price range where an asset trades sideways after a sharp move, often signaling a pause before the next directional swing.
Trendline: A line drawn connecting a series of rising lows or falling highs, used to track the underlying direction of a trend and spot potential support or resistance.
RSI (Relative Strength Index): An oscillator ranging from 0 to 100 that measures the speed and size of recent price moves, often used to flag overbought or oversold conditions.
Support: A price zone where past buying pressure has been strong enough to slow or reverse a decline.
Resistance: A price zone where past selling pressure has capped further upside.
Market Capitalization: Circulating supply of a token multiplied by its current price, used to measure overall network value.
Fully Diluted Valuation: What a token's market cap would be if its entire maximum supply were already in circulation at the current price.
Methodology
Price levels and chart patterns referenced in this Pi Network Price Prediction are drawn directly from the PI/USDT 4-hour chart on TradingView via OKX.
Market data reflects figures at the time of writing and is subject to change as new candles form.
No price targets in this piece extend beyond what is directly supported by the visible chart structure.
Disclaimer: This article is for informational purposes only and does not constitute financial, investment, or trading advice. Cryptocurrency markets, including Pi Network, are highly volatile and speculative. Prices can move sharply in either direction. Always do your own research and consult a qualified financial advisor before making investment decisions.
















