Pi Network Price Prediction: PI Ranks Above Bitcoin on OKX


Pi Network Coin launched as a mobile-first cryptocurrency project aimed at making mining accessible through smartphones rather than specialized hardware.
The project transitioned to an open mainnet in 2025, allowing PI to trade freely on major exchanges.
Pi Network price prediction analysis places, $PI currently trading at $0.09442, reflecting a 0.8% decline over the past 24 hours.
The token currently holds a market capitalization of approximately $1.052 billion, with a circulating supply of 11.142 billion coins out of a maximum supply of 100 billion.
Live Market Data
Metric | Value |
Current Price | $0.09442 |
24h Change | -0.8% |
24h Range | $0.0937 - $0.09628 |
Market Cap | $1.052B |
Fully Diluted Valuation | $1.619B |
24h Trading Volume | $6.145M |
Circulating Supply | 11.142B |
Total Supply | 17.141B |
Max Supply | 100B |
Source: Pi market cap data taken from CoinGecko, data as of Sep 05, 2026. Figures may vary slightly across other tracking websites.
Pi Network News
Community discussion around Pi Network has intensified this week after the token climbed to the top spot on OKX's trending asset chart, moving ahead of Bitcoin, Ethereum, and several other major cryptocurrencies.
Commentators note that the rise in attention has occurred even as PI's price has softened slightly, suggesting the interest stems from project developments rather than short-term price momentum alone.
Source: Data Taken From @BSCNews, X Account, As of Sep 05, 2026
Several updates appear to be driving the renewed attention. OpenPay's cash-in function is reportedly being revived, which would let Pioneers convert PI into fiat currency more directly.
A separate integration called RoboPay is said to be in development, aimed at letting users pay for services like delivery and inspection using $PI.
Additionally, App Studio has apparently shifted its fee structure from a flat subsidy model to one tied to actual AI usage costs, a change some see as an effort to build a more sustainable developer ecosystem around the network.
Pi Coin Forecast: Technical Analysis
The 4-hour chart shows the Pi Network price prediction trending inside a well-defined ascending channel that has held since late August.
Price recently touched the upper boundary of this channel before facing rejection, and it has since pulled back toward the midpoint.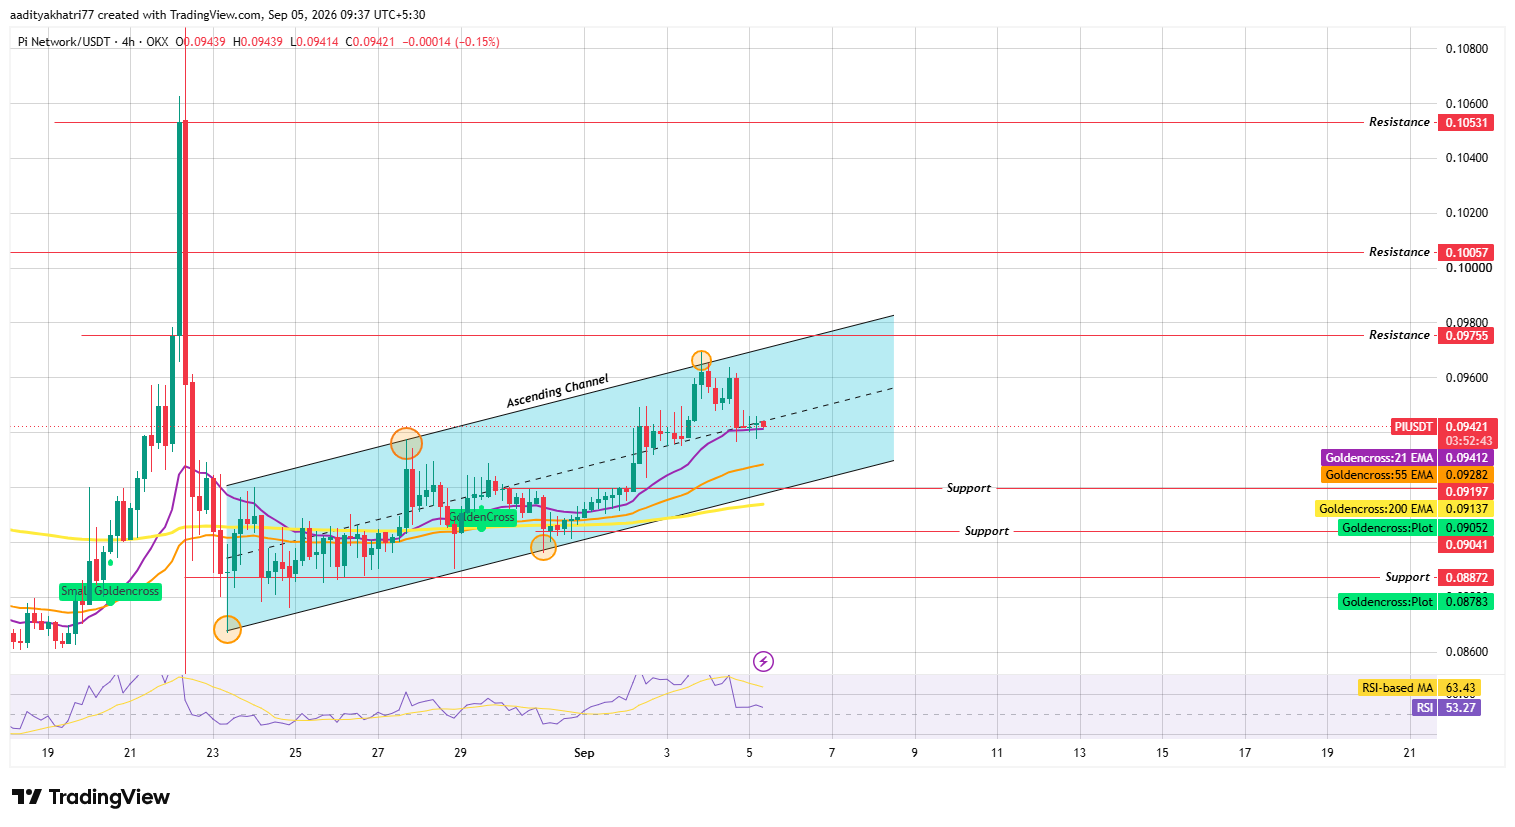
Source: Chart Taken From TradingView, As of Sep 5, 2026
At present, $PI is testing the 21 EMA at $0.09412, sitting just below the current price of $0.09421 on the chart.
The 55 EMA sits lower at $0.09282, while the 200 EMA rests at $0.09137, forming a layered support structure beneath the price.
Bullish scenario: If the price bounces from the 21 EMA on a confirmed 4-hour candle close with supporting volume and subsequently breaks above the ascending channel's upper boundary, the next resistance targets become $0.09755, followed by $0.10057 and $0.10531.
Bearish scenario: Should price fail to hold the 21 EMA and continue declining through the 55 EMA and 200 EMA, with a candle close below the channel's lower boundary, downside targets shift toward the support cluster at $0.09197, $0.09052, and $0.08872.
The RSI currently reads 53.27, positioned in neutral territory, while the RSI-based moving average sits higher at 63.43.
This gap suggests momentum has cooled slightly from recent highs but has not yet turned decisively bearish.
Support & Resistance Levels
Type | Level |
Resistance 3 | $0.10531 |
Resistance 2 | $0.10057 |
Resistance 1 | $0.09755 |
Support 1 | $0.09197 |
Support 2 | $0.09052 |
Support 3 | $0.08872 |
EMA Levels (4H Chart)
EMA | Price |
21 EMA | $0.09412 |
55 EMA | $0.09282 |
200 EMA | $0.09137 |
Glossary
Ascending Channel: A chart pattern formed by two parallel upward-sloping trendlines, containing price action between a rising support line and a rising resistance line.
EMA (Exponential Moving Average): A moving average type that assigns greater weight to recent price data, making it more responsive to new information than a simple moving average.
RSI (Relative Strength Index): A momentum indicator measuring the speed and magnitude of recent price changes, typically used to identify overbought or oversold conditions on a scale of 0 to 100.
Golden Cross: A pattern where a shorter-term moving average crosses above a longer-term moving average, often interpreted as a bullish signal.
Pi Coin vs Bitcoin
Pi Network's price behavior has shown limited direct correlation with Bitcoin in recent sessions, a divergence highlighted by its recent trending performance.
While Bitcoin's price movements often set the tone for broader market sentiment, PI's climb to the top of OKX's trending list occurred independently of major Bitcoin price today action, driven instead by project-specific utility news.
This suggests that, at least in the short term, PI's price prediction outlook may be shaped more by ecosystem developments than by Bitcoin's own trajectory.
Expert Opinion
Market commentators tracking Pi Network's recent trending performance have noted that the project's climb above Bitcoin and other major assets on OKX reflects renewed interest tied to utility rather than pure price speculation.
This view aligns with the technical setup, where price consolidation within the ascending channel suggests the market may be waiting for a clearer catalyst before committing to a direction.
Disclaimer: This Pi Network price prediction is based on technical chart analysis and current market data and should not be treated as financial advice. Cryptocurrency markets are highly volatile, and actual price movements may deviate significantly from projected scenarios. Support and resistance levels discussed represent probability zones, not guaranteed outcomes, and downside risk exists at every stage of this analysis. Readers should conduct independent research before making investment decisions.
















