Pi Network Price Prediction: Could PI Rally to $0.15 This Month?


Pi Network started out in 2019 as a phone-based mining app, long before PI ever became a token people could actually trade on Open Network.
Right now, the PI price today sits at $0.09461, up a modest 0.3% on the day. It hasn't strayed far from that spot either, bouncing between $0.09366 and $0.09478 over the last 24 hours.
In this Pi Network price prediction is close to breaking one way or the other. Whichever side gives up first will likely set the tone for the rest of the month.
Pi Network Coin Live Market Data
Metric | Value |
Price | $0.09461 |
Market Cap | $1.053B |
Fully Diluted Valuation | $1.62B |
24-Hour Trading Volume | $3.275M |
Circulating Supply | 11.142B PI |
Total Supply | 17.141B PI |
Max Supply | 100B |
Source: Pi Network market data taken from CoinGecko, as of Sep 08, 2026. Figures may vary slightly across other tracking websites.
Pi Network News: What Pi Network's Community Is Watching
No Burn, But a Scarcity Question Looms
One thing keeps coming up in Pi Network discussions this week, and it's not a price target. It's the fact that the project has never burned a single token.
No supply cuts, no scarcity mechanism, nothing. A recent post from the account Pi Update made this point directly, then added a twist: 
Source: Data Taken From @CoreNews_2, X Account, as of Sep 8, 2026
If Pi ever did introduce a real, transparent burn process down the line, pairing that with the utility and user base it already has could shift the whole narrative around the coin.
For now though, that remains a hypothetical, not something baked into today's price.
From Mining to Utility
There's also a broader story playing out about what Pi actually is at this point.
Where mining once pulled in millions of users, the network's current phase is supposed to be about using the token, not just collecting it. 
Source: Data Taken From @PiMigrate, X Account, as of Sep 8, 2026
An update from the account Pi Network News leaned into that framing, calling utility the next chapter for the project now that Open Network is live.
Developer Tooling Gets An Upgrade (via BSCN)
Then there's the developer side. BSCN reported that Pi Network rolled out new tools this week, including local storage support, staking data tied to specific apps, and file and video sharing. 
Source: Data Taken From @BSCNews, X Account, as of Sep 8, 2026
Fresh documentation came with it too, meant to walk developers through the entire process, from their first steps to actually shipping something. It's a build-phase update more than a headline-grabbing one.
Worth noting: none of this touches supply, and none of it is a listing or partnership announcement.
That context matters when you're trying to figure out how much these updates should actually move the price in the short term.
Pi Network Price Prediction: Technical Outlook
Pull up the daily PI/USDT chart on OKX, and the pattern is hard to miss. Since July, PI Coin has been grinding higher inside an ascending triangle, higher lows stacking up underneath a flat lid around $0.0949. 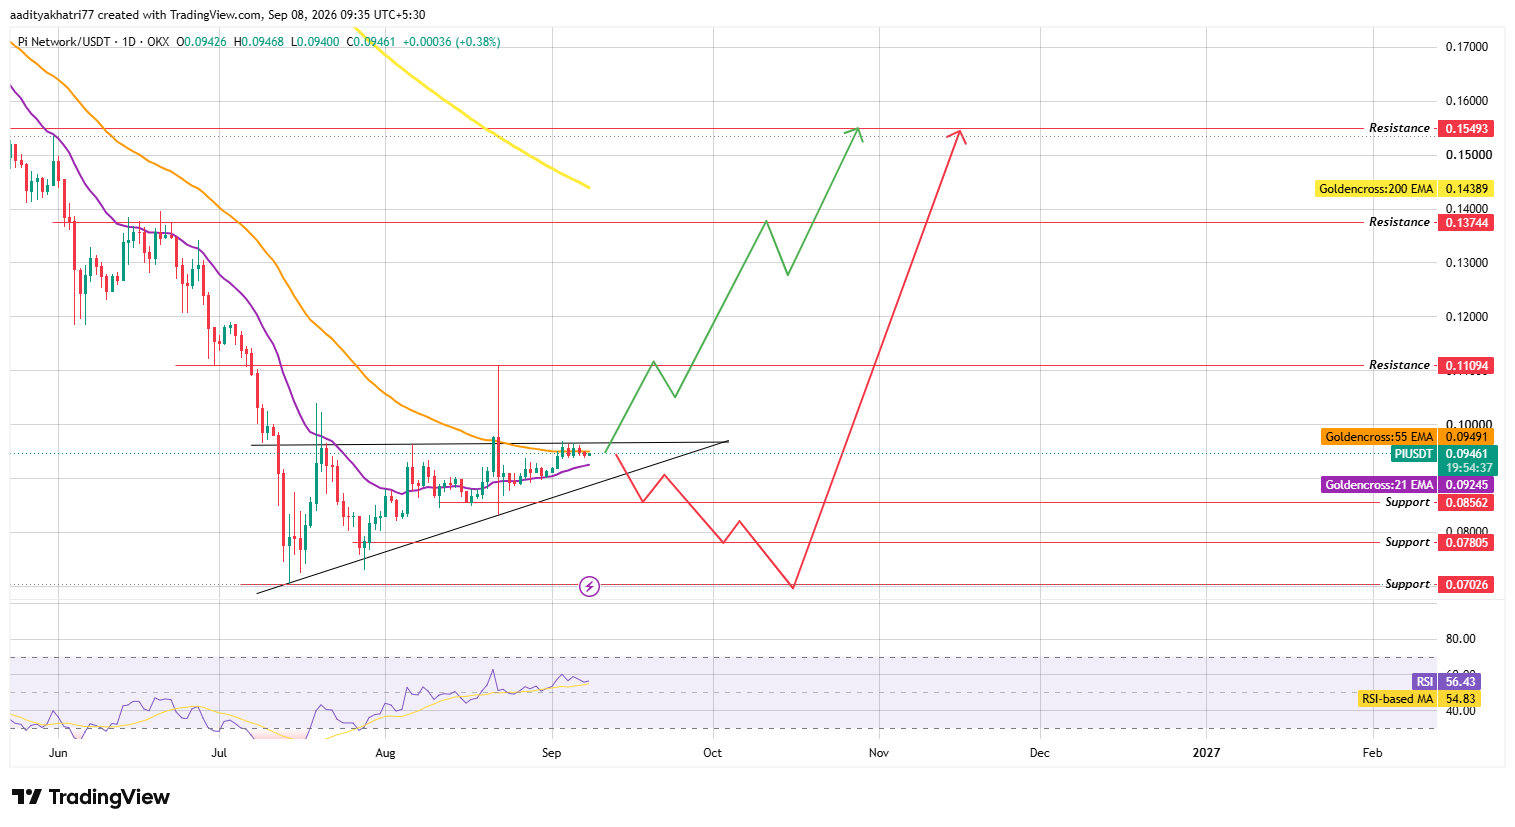
Source: Chart Taken From TradingView, as of Sep 8, 2026
RSI is reading 56.43 right now, sitting above its own moving average, which points to mild upward momentum without anything close to overbought conditions.
Could PI Break Toward Higher Resistance?
Here's the condition that matters: a daily close above $0.0949, paired with volume that clearly outpaces the 20-day average.
Get that, and the breakout is confirmed. From there, $0.11094 becomes the first real target, with $0.13744 next in line.
If the move still has legs by then, $0.15493 comes into play before the month is out.
What Happens If PI Breaks the Rising Trendline?
Flip the scenario. If sellers take control and price slips beneath the triangle's rising trendline instead, $0.08562 is the first level that should catch the fall.
Should that not hold, $0.07805 and then $0.07026 open up.
That outcome would basically mean the pattern failed to deliver the breakout everyone's been watching for.
Support and Resistance Levels
Support | Resistance |
$0.08562 | $0.11094 |
$0.07805 | $0.13744 |
$0.07026 | $0.15493 |
EMA Levels (Daily)
EMA | Level |
21 EMA | $0.09245 |
55 EMA | $0.09491 |
200 EMA | $0.14389 |
Bull, Base, and Bear Scenarios
Scenario | Setup | Level |
Bull | Daily close above $0.0949 with strong volume | $0.11094–$0.15493 |
Base | Continued consolidation inside the triangle | $0.0900–$0.0950 |
Bear | Break below rising trendline support | $0.08562–$0.07026 |
Glossary
Picture higher lows stacking beneath a flat ceiling, and you've basically got an ascending triangle, a setup that usually hints buyers are slowly winning the tug of war against a fixed resistance level.
A breakout is what happens when price finally punches through one of those boundaries for good, and traders generally want to see a strong candle close plus a jump in volume before trusting it, rather than a quick wick that fades.
EMAs work a bit like a running average of price, except they lean more heavily on the last few candles, so they tend to react faster than a plain moving average would.
RSI does something different: it measures how quickly and how far price has swung recently, which is how traders gauge whether something's gotten overbought or oversold.
And then there's support and resistance, simply the price zones where buyers or sellers have shown up strongly enough in the past to stall or reverse a move.
PI vs Bitcoin
PI doesn't really move on its own script. Its price action tends to follow Bitcoin's mood more than anything specific to Pi itself, and lately, with Bitcoin price today stuck in a tight range, $PI has settled into a similarly quiet pattern.
Part of that comes down to liquidity being thin, which leaves $PI more exposed to whatever risk appetite the wider market is showing at any given time.
Expert Opinion
According to market commentators who've been following Pi's chart setup closely, patterns like this rarely resolve gently.
A multi-week squeeze inside a shrinking range tends to snap harder than the slow grind that built it.
Their view is that volume, not this week's developer news, will end up deciding which way $PI goes, since nothing in the recent updates actually touches supply or exchange liquidity in a way that would move price on its own.
Disclaimer: This Pi Network price prediction is for informational purposes only and should not be treated as financial advice. Cryptocurrency markets are highly volatile, technical patterns can fail to play out as expected, and any of the scenarios described above carry a realistic probability of not occurring. Readers should conduct independent research before making any investment decisions.

















