Pi Network Price Prediction: Can PI Break Apex As Burn Talk Grows?


Pi Network's Open Network went live in February 2025, with $PI as its native token. Price is holding around $0.09375 right now, up 0.7% on the day.
That puts the network's market cap near $1.045 billion, ranking it #69 among all cryptocurrencies.
This PI network price prediction walks through where $PI could head from its current setup.
Live Market Data
Metric | Value |
Price | $0.09375 |
24h Change | +0.7% |
24h Range | $0.09262 – $0.09483 |
Market Cap | $1.045B |
Fully Diluted Valuation | $1.607B |
24h Trading Volume | $5.609M |
Circulating Supply | 11.142B |
Total Supply | 17.141B |
Max Supply | 100B |
Source: PI market cap data taken from CoinGecko, data as of Sep 03, 2026. Figures may vary slightly across other tracking websites.
Pi Network News
Crypto news outlet BSCN recently laid out why an aggressive PI burn program looks unlikely any time soon. 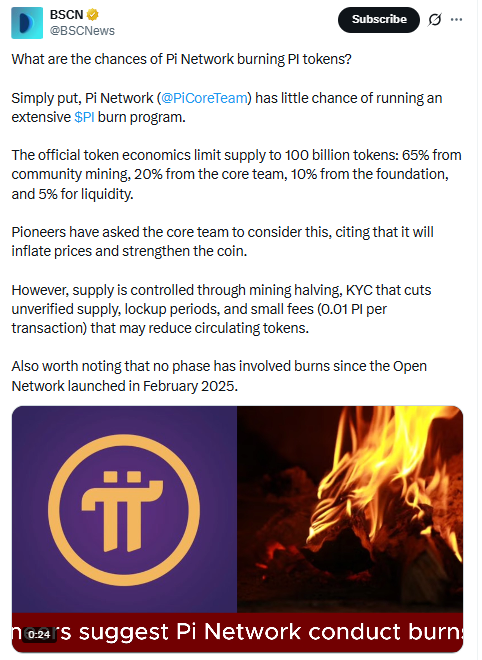
Source: Data Taken From @BSCNews, X Account, As of Sep 03, 2026
Their reporting points to the fixed 100 billion token supply split, 65% for community mining, 20% for the core team, 10% for the foundation, and 5% for liquidity, as a structure that leaves little flexibility for burning tokens outright.
Instead, supply control leans on halving schedules and KYC-based filtering of unverified holdings.
This is general market commentary based on public tokenomics data rather than an official statement from the $Pi Core Team, and it's worth treating the burn debate as an open community discussion for now.
Key Takeaways
$PI is trading near $0.09375, up 0.7% in the last 24 hours, sitting right at the apex of a daily symmetrical triangle.
A break above the falling trendline with volume support could send $PI toward $0.10417, $0.11875, and $0.12967.
A break below the rising trendline flips the setup bearish, opening the door to $0.08440, $0.07705, and $0.07030.
Community chatter around a possible $PI token burn is picking up, though the current tokenomics leave little room for one.
RSI sits at 56.37, just above its moving average, showing mild bullish momentum without being overbought.
Technical Analysis for Pi Coin Price Prediction
Symmetrical Triangle Structure
$PI has spent weeks squeezing into a symmetrical triangle on the daily chart, and the price is now sitting right at the apex where the two trendlines converge.
That's usually the point where a market has to pick a direction. 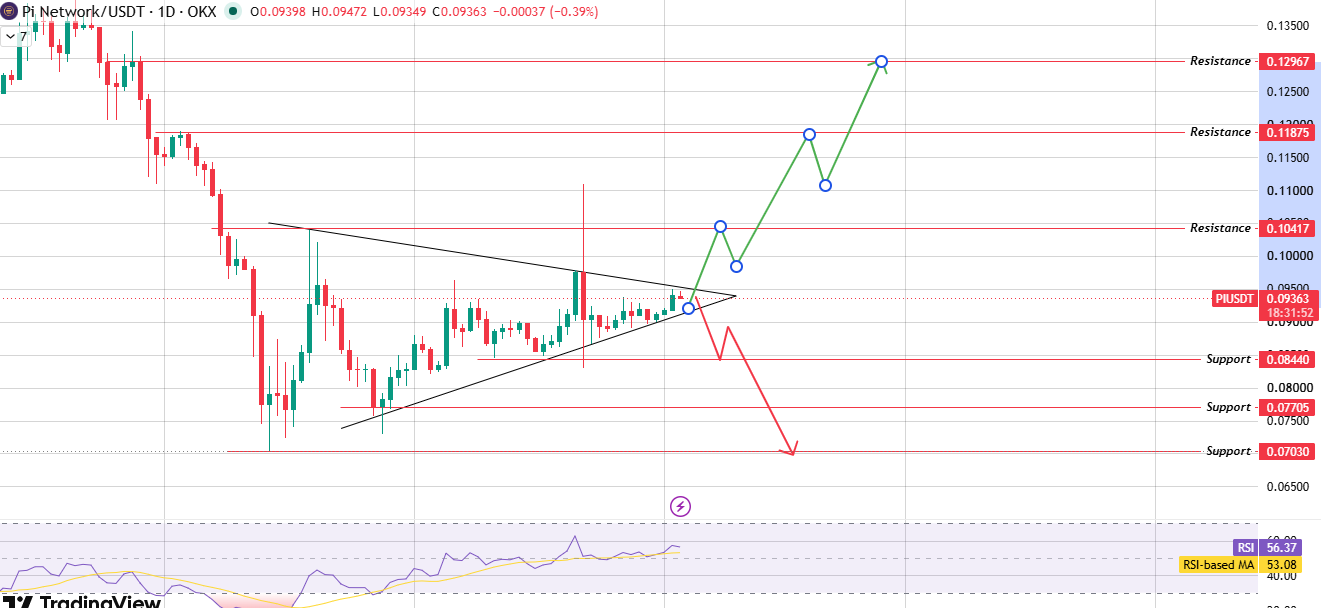
Source: Chart Taken From TradingView, As of Sep 3, 2026
Volatility tends to contract hard right before this kind of breakout, and $PI's recent daily ranges have been noticeably tighter than they were a few weeks back.
This is exactly the kind of setup that makes this Pi network price prediction worth watching closely over the next few sessions.
Momentum Check
RSI reads 56.37, just above its own moving average of 53.08. Nothing looks extreme either way., but the tilt is mildly bullish.
Momentum indicators near an apex like this don't carry much weight on their own. They matter more once the price actually commits to one side of the triangle.
Breakout and Breakdown Scenarios
For the bullish path: a full daily candle needs to close above the triangle's falling trendline, and that close should come with volume above recent average.
Get both conditions, and $0.10417 becomes the first level, with $0.11875 and $0.12967 further out in this pi coin price prediction.
A daily close below the rising trendline, again backed by volume, would confirm a breakdown. From there $0.08440 is the first level to watch, followed by $0.07705 and $0.07030 if selling keeps up.
Support and Resistance Levels (Daily Chart)
Level Type | Price |
Resistance 3 | $0.12967 |
Resistance 2 | $0.11875 |
Resistance 1 | $0.10417 |
Support 1 | $0.08440 |
Support 2 | $0.07705 |
Support 3 | $0.07030 |
Levels reference the 1-day candle close on the PI/USDT chart, OKX, and UTC.
Bull, Base, and Bear Case for $PI
Scenario | Trigger | Price levels |
Bull Case | Daily candle closes above the triangle's falling trendline with volume clearing the recent average. | $0.10417, then $0.11875, then $0.12967 |
Base Case | Price keeps compressing near the apex, chopping between the two converging trendlines without a clean break. | Range-bound roughly between $0.09262 and $0.09483 |
Bear Case | The daily candle closes below the triangle's rising trendline, confirmed by volume. | $0.08440, then $0.07705, then $0.07030 |
Disclaimer: This Pi network price prediction is based on technical chart analysis and publicly available data, and it isn't financial advice. $PI remains a relatively new, volatile asset, and the price could fall well below the support levels discussed here if broader sentiment turns negative or the triangle breaks down hard. Community discussions like the token burn debate can shift quickly and don't guarantee any particular price outcome. Do your own research and weigh your own risk tolerance before making any decisions.
Also read:
















