Pi Network Price Prediction: PI Coin Eyes Breakout on DeFi News


Pi Network launched back in 2019 as a mobile app that let ordinary phone users mine a cryptocurrency by tapping a button once a day; no mining rig or drained battery was required.
A small team with Stanford roots built it, and for years it stayed in a closed loop where millions of people simply collected coins with no real market behind them.
That changed in February 2025, when Pi Network opened its mainnet to the outside world and $PI started trading on exchanges for the first time.
Anyone searching for a Pi Network price prediction today will find $PI trading around $0.09457, up 3.3% over the last 24 hours.
Its market capitalization sits close to $1.053 billion on a circulating supply above 11.142 billion tokens.
Live Market Data
Metric | Value |
Price | $0.09457 |
24h Change | +3.3% |
Market Cap | $1.053B |
Fully Diluted Valuation | $1.62B |
24h Trading Volume | $5.533M |
Circulating Supply | 11.142B |
Total Supply | 17.141B |
Max Supply | 100B |
24h Range | $0.09102 – $0.09477 |
Source: $PI market data taken from CoinMarketCap, data as of Sep 02, 2026. Figures may vary slightly across other tracking websites.
Pi Network News
Pi Network news this week is centered on a fresh DeFi push rather than just price action.
The Pi Core Team has activated a comprehensive DeFi infrastructure on its testnet, complete with a native swap interface and real-time market intelligence for test tokens.
The pilot rollout features a test token called SLICE, which currently carries a test market capitalization of 27.75M Test-Pi on a circulating supply of 1.16B units. 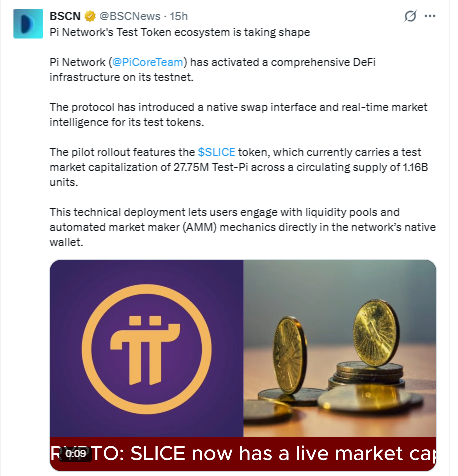
Source: Data Taken From @BSCNews, X Account, As of Sep 02, 2026
This deployment lets users engage with liquidity pools and automated market maker mechanics directly inside the network's native wallet.
That's a meaningful step for a project that spent years being dismissed as "just a mining app." Building out real swap and AMM infrastructure, even on testnet, signals Pi Network is laying groundwork for actual decentralized finance activity, and it's a big part of why $PI has been trending in crypto circles this week.
Key Takeaways
$PI trades near $0.09457, up 3.3% in the past day, currently pushing toward the upper boundary of an ascending channel on the 4-hour chart.
Price is holding above the 21 EMA at $0.09177, with resistance layered at $0.09753, $0.10063, and $0.10629.
A rejection at the upper channel boundary could send price back toward support at $0.08833, $0.08556, and $0.08305.
RSI on the 4H chart reads 74.69, on the hotter side, suggesting the recent move up has been fairly aggressive.
Market cap sits near $1.053 billion on a circulating supply of 11.142 billion $PI.
Technical Analysis of Pi Network Price
Price Tests the Upper Edge of an Ascending Channel
The 4-hour PI/USDT chart on OKX shows price boxed inside an ascending channel, a rising corridor bound by a lower and upper trendline that PI has respected for a stretch now.
Price is currently pushing up toward the upper boundary of that channel, and this is the moment that decides where PI heads next.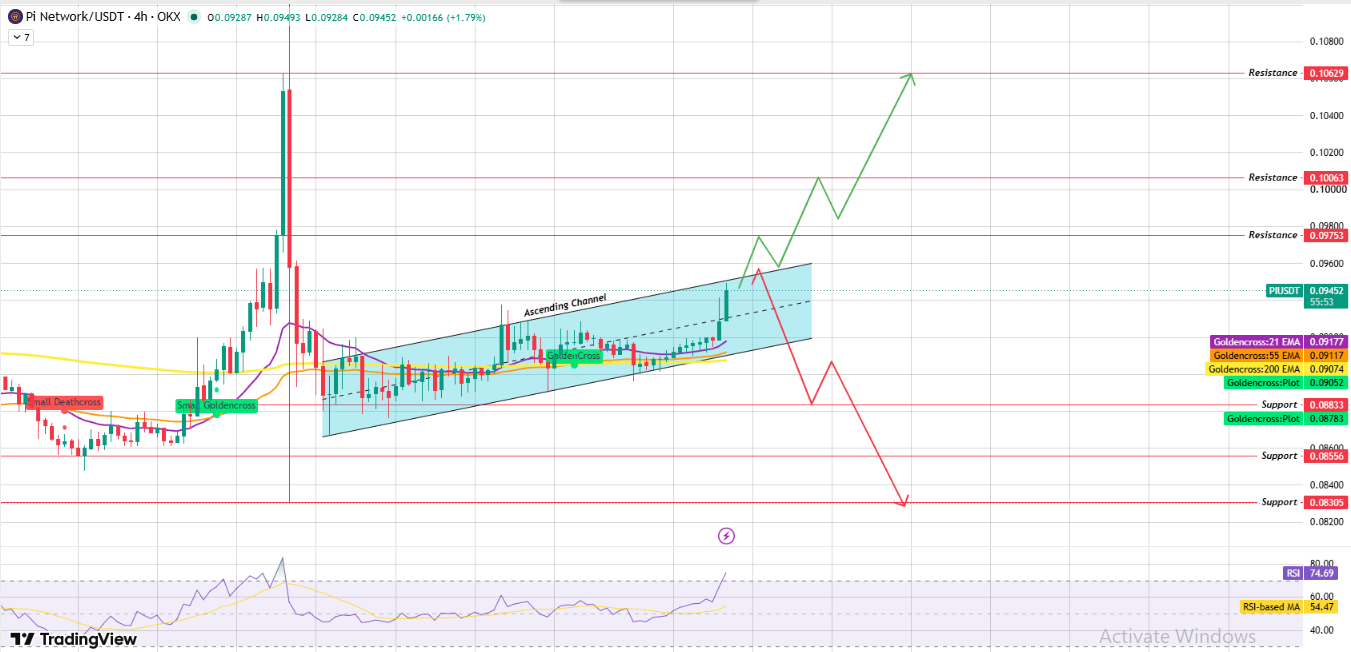
Source: Chart Taken From TradingView, As of Sep 2, 2026
If PI manages to break above the upper boundary on strong volume, it opens a path toward the resistance zone at $0.09753, then $0.10063, and eventually $0.10629.
A volume-backed breakout is the key tell here; without real buying pressure behind it, a push above the channel can just as easily fade back inside.
If the price instead gets rejected at the upper boundary, the more likely path is a slide back toward the lower boundary of the channel.
Should that lower boundary also give way, PI could be looking at a drop toward support levels around $0.08833, $0.08556, and $0.08305.
Moving Averages Still Favor the Bulls
PI near $0.09452 is trading above the 21 EMA at $0.09177, the 55 EMA at $0.09117, and the 200 EMA at $0.09074, with a recent golden cross forming near $0.09052.
All three EMAs stacking beneath the current price keep the short-term structure tilted upward.
A slip back under the 21 EMA would put the 55 and 200 EMAs and the golden cross zone back in focus as the next line of defense.
What Confirms the Breakout, and What Rejection Looks Like
For the channel breakout to carry real weight, the price needs to close above the upper boundary with volume exceeding recent averages, not just wick above it briefly.
Without that, the move stays unconfirmed, and $PI risks slipping back inside the channel.
If resistance near $0.09753 rejects price instead, support steps down toward $0.08833, then $0.08556, with $0.08305 as the next cushion below.
EMA Levels
EMA | Value | Price Position |
21 EMA | $0.09177 | Price trading above |
55 EMA | $0.09117 | Price trading above |
200 EMA | $0.09074 | Price trading above |
Golden Cross | $0.09052 | Price trading above |
Support and Resistance Levels
Level | Price |
Resistance 3 | $0.10629 |
Resistance 2 | $0.10063 |
Resistance 1 | $0.09753 |
Support 1 | $0.08833 |
Support 2 | $0.08556 |
Support 3 | $0.08305 |
Bull, Base, and Bear Case
Scenario | Price Range | Key Trigger |
Bull Case | $0.09753 – $0.10629 | The price closes above the ascending channel upper boundary with strong volume. |
Base Case | $0.08833 – $0.09753 | PI chops between the channel boundaries without a decisive break either way. |
Bear Case | $0.08305 – $0.08833 | The upper boundary rejects the price, and the channel breaks down to the downside. |
Expert Opinion
Coverage from BSCN has framed the DeFi testnet rollout, including the SLICE token pilot, as a sign that Pi Network's ecosystem is taking real shape beyond its mobile mining roots.
That said, this remains commentary on infrastructure development rather than a verified technical signal for PI's own price.
Traders following this Pi Network price prediction will likely weigh a confirmed close above the channel's upper boundary, backed by volume, more heavily than headline news alone.
Glossary
Ascending channel: A rising corridor bound by two upward-sloping lines, where price keeps making higher highs and higher lows. Traders watch the edges closely since that's usually where the next big move gets decided.
EMA: Short for Exponential Moving Average, weighted so recent candles count for more than older ones. That extra weighting is why it reacts faster to short-term shifts than a plain moving average.
Golden cross: What happens when a shorter EMA crosses above a longer one. Momentum traders often read it as an early shift in trend bias, nothing more definitive than that.
RSI: Short for Relative Strength Index, a momentum gauge running from 0 to 100. Readings above 70 are generally read as overheated; below 30 as oversold. PI's current reading of 74.69 falls into that hotter zone.
Resistance: A price level where an asset has struggled to push past before, usually because sellers step in around that zone.
Support: The flip side of resistance, a price zone where buyers have historically stepped in to stop a fall.
Methodology
This $Pi Network price prediction starts with a 4-hour chart on OKX, viewed through TradingView. It's paired with live data on price, market cap, and supply.
Every level cited here comes straight from that chart; nothing is pulled from an outside calculator or rounded estimate.
The DeFi testnet update mentioned in the $Pi Network News section is sourced from a public post and is flagged as commentary on ecosystem development, not a price signal.
Disclaimer: This article is for informational purposes only and does not constitute financial or investment advice. The bull, base, and bear scenarios above are derived from technical chart patterns and carry meaningful uncertainty. Crypto assets such as Pi Network can move sharply within a single session, and any of these outcomes could fail to materialize. Past performance and chart patterns do not guarantee future results. Only invest funds you can afford to lose, and consult a licensed financial advisor before making investment decisions.
















