Pi Network Price Prediction: PI's Recovery Story Just Got Bigger


Pi Network is a mobile-first crypto project that first drew massive attention by letting users mine PI coins from their phones, building one of the largest crypto communities in the world well before the token was tradable.
Today, PI is trading around $0.09045, down about 1.4 percent over the last 24 hours, as the market weighs a notable shift in chart structure against a backdrop of ongoing recovery talk.
This Pi Network price prediction looks at where the coin could be headed next.
Live Market Data
Metric | Value |
Price | $0.09045 (-1.4%) |
24h Range | $0.08973 to $0.09176 |
Market Cap | $1.007B |
Fully Diluted Valuation | $1.549B |
24h Trading Volume | $3.749M |
Circulating Supply | 11.13B |
Total Supply | 17.124B |
Max Supply | 100B |
Source: $PI market cap data taken from Coingecko, data as of Aug 31, 2026. Figures may vary slightly across other tracking websites.
Pi Network New Today
Broader crypto community chatter has turned modestly positive on Pi Network recently, with some tracking accounts noting $PI is up around 12% over the past month and about 2.3% over the past week, a recovery that has largely tracked the wider crypto market's own bounce. 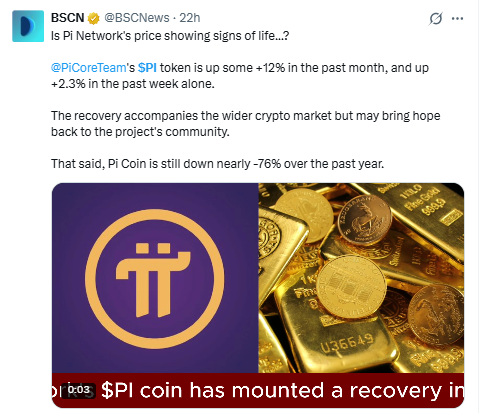
Source: Data Taken From @BSCNews, X Account.
Even so, PI remains down close to 76% over the past year, a reminder that this recent uptick is still a small step against a much larger long-term drawdown.
Separately, there has also been talk around Pi Network's ecosystem direction, with some accounts describing PI as being positioned as a central liquidity layer meant to connect activity across marketplaces, gaming, NFTs, DeFi, lending, staking, and payments within the network. 
Source: Data Taken From @Web3news_Org, X Account.
If adoption in these areas actually builds up, it could add a genuine demand driver over time, though this kind of ecosystem framing is still an early stage and worth treating as a developing narrative rather than a confirmed catalyst.
Key Takeaways
PI is trading near $0.09045, sitting inside a freshly formed ascending channel after breaking out of a long-standing descending channel on the daily chart.
A break above the first resistance at $0.09624 could open the door toward $0.11095 and eventually $0.13027.
A rejection at resistance followed by a break of the ascending channel's lower boundary could send $PI back toward the $0.08051 support and potentially $0.07025 below that.
RSI is reading 50.69, right around its own moving average of 51.90, putting the market in a neutral zone as it awaits a clear breakout.
$PI is up roughly 12% over the past month and 2.3% over the past week, even though it remains down close to 76% over the past year.
Technical Analysis
On the daily chart, $PI spent an extended stretch trading inside a descending channel, marking a steady series of lower highs and lower lows that reflected persistent selling pressure.
That changed when the price broke above the channel's upper boundary, a shift that typically signals fading downside momentum and buyers stepping back in. 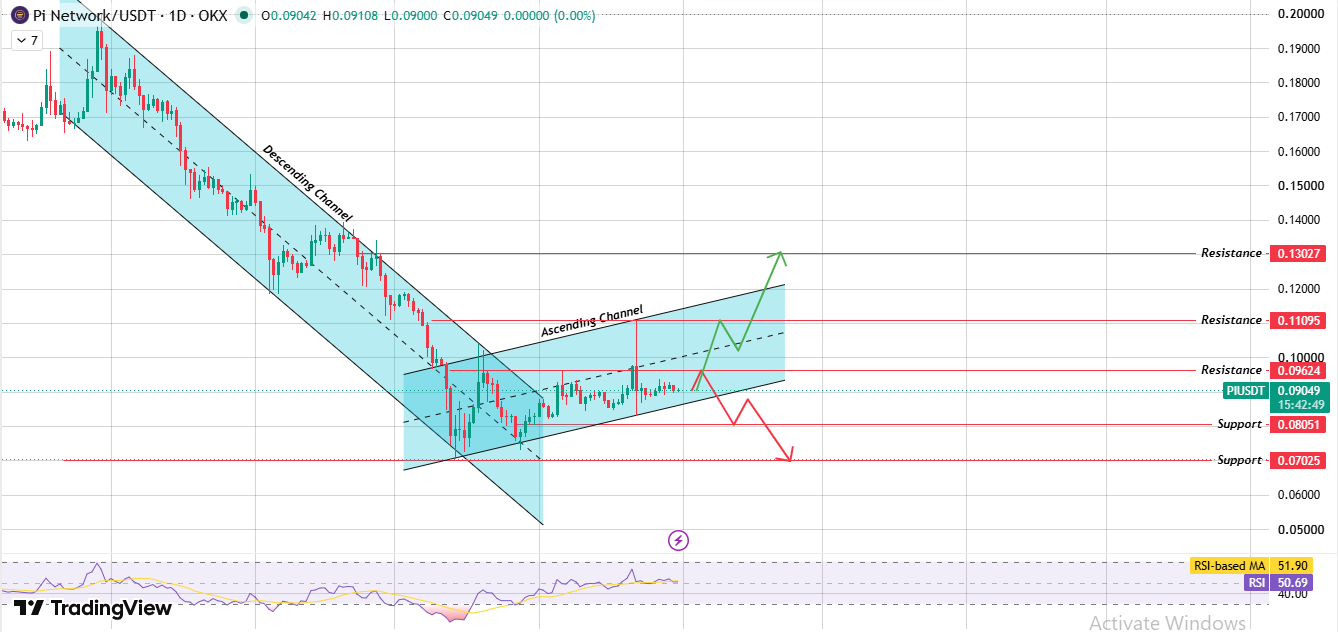
Source: Chart Taken From TradingView.
Since that breakout, $PI has been building a new structure that now looks like an ascending channel., and price is currently trading inside it.
RSI is sitting at 50.69, almost in line with its own moving average of 51.90. Both readings sitting near the midpoint suggest the market is neither overbought nor oversold right now, which fits a chart that looks like it's coiling ahead of its next real directional move.
Ascending Channel in Focus
The ascending channel is the structure to watch for this Pi Network price prediction.
If price clears the first resistance at $0.09624 and holds above it, the setup opens toward $0.11095 as the next level, with $0.13027 as a further stretch goal, a level that lines up roughly with where the earlier descending channel began.
If instead the price gets rejected here and slips below the channel's lower boundary, PI could head back down toward the $0.08051 support, with $0.07025 as the next level to watch if that support doesn't hold.
Why the Neutral RSI Matters
With RSI hovering right around the 50 mark, there's no strong momentum bias baked into the chart at the moment.
That kind of setup often precedes a sharper move once price actually commits to a direction, since neither buyers nor sellers currently have a clear technical edge.
Traders watching this Pi Network price prediction will likely treat a decisive RSI push above or below its moving average as an early confirmation signal alongside the channel breakout.
Support and Resistance Levels
Level Type | Price |
Resistance 3 | $0.13027 |
Resistance 2 | $0.11095 |
Resistance 1 | $0.09624 |
Current Price | $0.09049 |
Support 1 | $0.08051 |
Support 2 | $0.07025 |
Bull, Base, and Bear Case
Scenario | Level | Setup | Invalidation |
Bull | $0.09624 to $0.13027 | Price clears $0.09624 resistance and holds inside the ascending channel with rising volume. | Rejection at $0.09624 and drop back below the channel's midline |
Base | $0.08051 to $0.09624 | Price continues chopping inside the ascending channel, unable to clear resistance. | Break of either the channel's lower boundary or a clean close above $0.09624 |
Bear | Below $0.08051 | Ascending channel breaks down, support beneath it fails. | Reclaim of $0.08051 and the ascending channel structure |
Analysts following this Pi Network price prediction generally view the shift from a descending channel to an ascending one as a meaningful, if still unconfirmed, change in structure.
The neutral RSI reading reinforces the idea that the market is in a wait-and-see mode rather than committed to a strong trend either way.
Most technical voices want to see a clean, volume-backed break above $0.09624 before getting more confident about a run toward the higher resistance levels, while acknowledging that a failure to hold the ascending channel would quickly put the $0.08051 and $0.07025 supports back in focus.
Glossary
Descending Channel: A downward-sloping price structure formed by a series of lower highs and lower lows, reflecting consistent selling pressure.
Ascending Channel: An upward-sloping price structure formed by a series of higher highs and higher lows, typically reflecting building buying pressure.
RSI: Relative Strength Index, a momentum indicator measuring how fast and how much price has moved recently, typically read on a scale of 0 to 100.
RSI-based Moving Average: A smoothed average of the RSI line itself, used to gauge whether momentum is turning up or down.
Support Level: A price zone where buying pressure has historically stepped in to slow or reverse a decline.
Resistance Level: A price zone where selling pressure has historically capped further gains.
Market Cap: The total value of all coins currently in circulation, calculated as price multiplied by circulating supply.
Fully Diluted Valuation (FDV): The theoretical total market value of a coin if its entire max supply were in circulation today.
Methodology
This Pi Network price prediction is built using the daily chart pattern, including the descending-to-ascending channel transition, marked support and resistance levels, and RSI readings, combined with current market cap, supply, and volume data.
All price levels referenced are taken directly from the chart provided and are not extrapolated beyond what the pattern shows.
Market sentiment context is drawn from recent public reporting on Pi Network's short-term price recovery and its ecosystem positioning.
Disclaimer: This article is for informational purposes only and should not be treated as financial advice. Cryptocurrency markets are highly volatile, and prices can move sharply in either direction within short periods. Always do your own research and consult a qualified financial advisor before making any investment decisions.
Also read:
2 weeks ago
Honestly, I didn't know where to turn after losing my Bitcoin in an online scam. I was frustrated and unsure of the next steps, so I contacted WEB WIZARD CRYPTO RECOVERY EXPERTS. They took the time to listen to what happened, reviewed the transaction details I had, and explained the investigation process in a way I could understand. I appreciated their professionalism and straightforwardness throughout the entire process, especially when they explained what could realistically be investigated. I am very happy to have successfully recovered my Bitcoin. The experience gave me a much clearer understanding of my case. If you are facing a similar problem to the one I had before recovering my funds, I personally recommend contacting WEB WIZARD CRYPTO RECOVERY EXPERTS for help. Email: (fundrecoverywebwizard@mail.com) Website: https://webwizardcryptorecoveryexperts.simdif.com/

1 month ago
HOW TO GET A PROFESSIONAL RECOVERY EXPERT IN CANADA, UNITED STATES, MEXICO, INDIA, CHINA META TECH RECOVERY PRO META TECH RECOVERY PRO is a trusted, independent cyber-intelligence and digital recovery firm. We investigate and remediate sensitive information incidents across multiple blockchain and financial environments, including Bitcoin, USDT, USDC, Ethereum, and other widely used digital assets. Our mission is to help clients regain control, protect data, and restore integrity after unauthorized access, fraud, personal information exposure, or inappropriate online content. WhatsApp +1 469 692 8049 Using disciplined digital forensics and risk analysis, we provide end-to-end recovery support: tracing suspicious activity, identifying likely sources of cyber incidents, reconstructing event timelines, and performing secure data recovery when feasible. We also assist with consent-free exposure removal or erasure, including confidential records, private images, doxing-related content, and other materials that violate privacy standards. Contact them via Metatech@Writeme.Com Our method is professional and structured: each engagement begins with an assessment of incident scope, impacted platforms or accounts, and available indicators. We then apply targeted techniques such as digital footprint analysis, linkage evaluation across online identifiers, and verification of transaction or account trails to determine the most effective recovery and mitigation path. We operate under a NO UPFRONT fee model until completion, ensuring accountability, aligning incentives with client objectives, and reducing financial uncertainty. Clients typically seek help with hacked wallets or compromised accounts, suspicious crypto transfers, identity exposure, unlawful posting of private content, impersonation, online harassment, and other forms of digital wrongdoing. We deliver actionable outcomes, including enhanced protection measures, targeted takedown support, and recovery strategies designed to minimize recurrence. If your personal data has been leaked, your accounts compromised, or inappropriate content has appeared online, we can investigate promptly and pursue resolution with discretion, accuracy, and professionalism.Reach out to them via - Telegram:@metatechrecoveryproteam - - WhatsApp: +1 4 6 9 6 9 2 8 0 4 9 - - Metatech@Writeme.Com -
1 month ago
HOW TO GET A PROFESSIONAL RECOVERY EXPERT IN CANADA, UNITED STATES, MEXICO, INDIA, CHINA META TECH RECOVERY PRO META TECH RECOVERY PRO is a trusted, independent cyber-intelligence and digital recovery firm. We investigate and remediate sensitive information incidents across multiple blockchain and financial environments, including Bitcoin, USDT, USDC, Ethereum, and other widely used digital assets. Our mission is to help clients regain control, protect data, and restore integrity after unauthorized access, fraud, personal information exposure, or inappropriate online content. WhatsApp +1 469 692 8049 Using disciplined digital forensics and risk analysis, we provide end-to-end recovery support: tracing suspicious activity, identifying likely sources of cyber incidents, reconstructing event timelines, and performing secure data recovery when feasible. We also assist with consent-free exposure removal or erasure, including confidential records, private images, doxing-related content, and other materials that violate privacy standards. Contact them via Metatech@Writeme.Com Our method is professional and structured: each engagement begins with an assessment of incident scope, impacted platforms or accounts, and available indicators. We then apply targeted techniques such as digital footprint analysis, linkage evaluation across online identifiers, and verification of transaction or account trails to determine the most effective recovery and mitigation path. We operate under a NO UPFRONT fee model until completion, ensuring accountability, aligning incentives with client objectives, and reducing financial uncertainty. Clients typically seek help with hacked wallets or compromised accounts, suspicious crypto transfers, identity exposure, unlawful posting of private content, impersonation, online harassment, and other forms of digital wrongdoing. We deliver actionable outcomes, including enhanced protection measures, targeted takedown support, and recovery strategies designed to minimize recurrence. If your personal data has been leaked, your accounts compromised, or inappropriate content has appeared online, we can investigate promptly and pursue resolution with discretion, accuracy, and professionalism.Reach out to them via - Telegram:@metatechrecoveryproteam - - WhatsApp: +1 4 6 9 6 9 2 8 0 4 9 - - Metatech@Writeme.Com -
1 month ago
Impactful Best and Legitimate Cryptocurrency Recovery Agency Good Top 2 Best and Authentic Crypto Recovery Agencies Review META TECH RECOVERY PRO Bitcoin and cryptocurrency tracing and recovery services help individuals and organizations locate, verify, and recover digital assets when access becomes difficult due to hardware failure, corrupted files, lost backups, or incomplete wallet records. These services are built around the reality that crypto ownership is tied to blockchain addresses, but the ability to spend or move funds depends on controlling the corresponding private keys or restoring the wallet data that contains them. When a wallet file or drive is compromised, the recovery process becomes both a technical and investigative effort—combining digital forensics, blockchain analysis, and careful validation of results. This is where META TECH RECOVERY PRO plays a critical role. Their team did more than perform basic file recovery attempts; they applied structured recovery methods to restore the usable wallet information as much as possible. Beyond the recovery itself, tracing services often include linking recovered addresses to transaction history, confirming balances, and ensuring that the funds are correctly associated with the wallet being reconstructed. Reach out to them via - Telegram:@metatechrecoveryproteam - - WHATSAPP + 1 4 6 9 6 9 2 8 0 4 9 - - Metatech@Writeme.Com - For me, the process ultimately proved successful. The professionals at META RECOVERY PRO helped recover the Bitcoin I had on the drive even after I believed the situation was a lost cause. What made the outcome especially valuable was not only the restoration of access, but also the confidence that the recovered wallet corresponded to actual on-chain holdings. As a result, my earlier investment paid off in a way I did not expect, and I was able to reclaim and benefit from those funds thanks to the expertise and persistence of the recovery specialists.
1 month ago
Impactful Best and Legitimate Cryptocurrency Recovery Agency Good Top 2 Best and Authentic Crypto Recovery Agencies Review META TECH RECOVERY PRO Bitcoin and cryptocurrency tracing and recovery services help individuals and organizations locate, verify, and recover digital assets when access becomes difficult due to hardware failure, corrupted files, lost backups, or incomplete wallet records. These services are built around the reality that crypto ownership is tied to blockchain addresses, but the ability to spend or move funds depends on controlling the corresponding private keys or restoring the wallet data that contains them. When a wallet file or drive is compromised, the recovery process becomes both a technical and investigative effort—combining digital forensics, blockchain analysis, and careful validation of results. This is where META TECH RECOVERY PRO plays a critical role. Their team did more than perform basic file recovery attempts; they applied structured recovery methods to restore the usable wallet information as much as possible. Beyond the recovery itself, tracing services often include linking recovered addresses to transaction history, confirming balances, and ensuring that the funds are correctly associated with the wallet being reconstructed. Reach out to them via - Telegram:@metatechrecoveryproteam - - WHATSAPP + 1 4 6 9 6 9 2 8 0 4 9 - - Metatech@Writeme.Com - For me, the process ultimately proved successful. The professionals at META RECOVERY PRO helped recover the Bitcoin I had on the drive even after I believed the situation was a lost cause. What made the outcome especially valuable was not only the restoration of access, but also the confidence that the recovered wallet corresponded to actual on-chain holdings. As a result, my earlier investment paid off in a way I did not expect, and I was able to reclaim and benefit from those funds thanks to the expertise and persistence of the recovery specialists.
1 month ago
Recovery of 31,000 USDT Following a Crypto Trading Bot Scam “I subscribed to what I believed was a state-of-the-art cryptocurrency arbitrage trading bot. The company advertised the software as revolutionary, claiming a 98% win rate and integration with leading global exchanges. Their platform looked highly professional, with testimonials, demonstrations, and real-time performance charts that appeared to show successful trading activity. I paid 31,000 USDT for a one-year subscription. The package also included access to a proprietary wallet that I was told was required to connect to the trading system. Initially, everything appeared legitimate. The application displayed daily profits, successful transactions, charts, and performance metrics. For the first few days, I genuinely believed I had made a smart investment. Then everything changed. The bot stopped operating, the application began crashing, and the company's support channels became unresponsive. I could no longer access the wallet, and repeated login attempts resulted in errors. I began researching the company online and discovered numerous complaints from other users describing remarkably similar experiences. It became clear that we had been deceived by what appeared to be an elaborate cryptocurrency investment scam. I was extremely concerned that my 31,000 USDT was gone for good. Thankfully, I found Sagittarius Cypher Cyber Intelligence through Reviews.com and contacted their team. After reviewing the circumstances, their investigators identified several red flags associated with the operation and began tracing the movement of funds through blockchain transactions. Their investigation identified cryptocurrency addresses associated with the operation and helped establish the movement of the funds. With the assistance of Sagittarius Cypher Cyber Intelligence's recovery specialists, my full 31,000 USDT was ultimately recovered. I was honestly shocked. I had already accepted that my money might never come back. The professionalism, investigation, communication, and technical expertise demonstrated throughout the process gave me confidence when I needed it most. I am extremely grateful for the assistance I received from Sagittarius Cypher Cyber Intelligence. If you believe you have been the victim of a cryptocurrency scam, I strongly recommend documenting everything, preserving your transaction records and wallet information, and seeking professional assistance as quickly as possible. support team info are below. 📧 info@sagittariuscyphercyberintelligence.com 📱 WhatsApp: +1 (226) 457-3805 💬 Telegram: @sagittariuscyphercyber
















