Pi Network Price Prediction: Will $PI Finally Blast Above $0.10?


PI is boxed in right now. Rising support on one side, a flat wall of resistance on the other. Whichever gives way first probably decides how the rest of the month plays out.
Strong buying could push it toward the next resistance band pretty quickly.
Fail to hold, though, and it slides back to levels the coin hasn't touched in weeks. So which way does it break? Nobody knows yet, and that's really the honest answer.
This pi network price prediction sticks to what the chart is actually showing instead of picking a side early.
Live Market Data
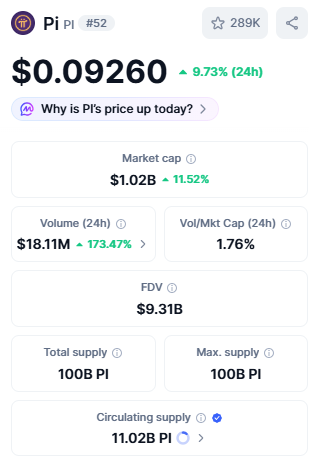
Source: $PI Market Cap Data Taken From CoinMarketcap, data as of Aug 06, 2026. Figures may vary slightly across other tracking websites.
Pi Network Social Sentiment
What's actually moving the needle right now? The Fabric Foundation's new partnership with RoboPay, announced through the Pi Core Team, stands out. 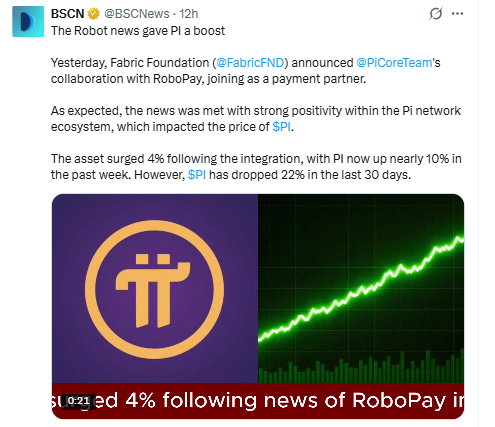
Source: Data Taken From @BSCNews , X Account.
It's already dragged weekly gains close to 10%, and that's not nothing for a coin that spent the last month sliding.
Whether this bounce sticks or fades probably comes down to a few things: more payment integrations landing, any exchange listing news, and where BTC dominance heads next.
Worth remembering, too, that rising BTC dominance tends to squeeze altcoins like PI regardless of how good the local news is.
On-Chain Drivers
Here's the number that matters most long-term: only 11.02B of the 100B max supply is circulating.
That's roughly 89% still sitting outside the market. Big gap.
Any serious pi network price prediction has to sit with that fact, because unlocks down the road can quietly work against even the cleanest chart setup.
On the brighter side, 24h volume just jumped to $18.11M, a spike of over 173%.
That kind of interest returning is a far better setup for a breakout attempt than the low-volume drift PI has dealt with lately.
Key Takeaways
-
PI trades near $0.0926 right now, up sharply on volume after a payments partnership hit the news
-
A confirmed pi network price prediction breakout needs a close above $0.10389 with real volume behind it
-
Lose $0.08261, and a liquidity sweep toward $0.07029 becomes the likely outcome
-
Only 11% of max supply is even circulating yet, a dilution overhang that's easy to ignore until it isn't
-
RSI sitting near 53 means neutral territory, not overbought, so there's still room to run either way
Technical Analysis of $PI Network:
4-hour Chart Analysis of $PI
Zoom into the 4H chart, and PI is trading inside an ascending channel, currently leaning on the upper boundary. 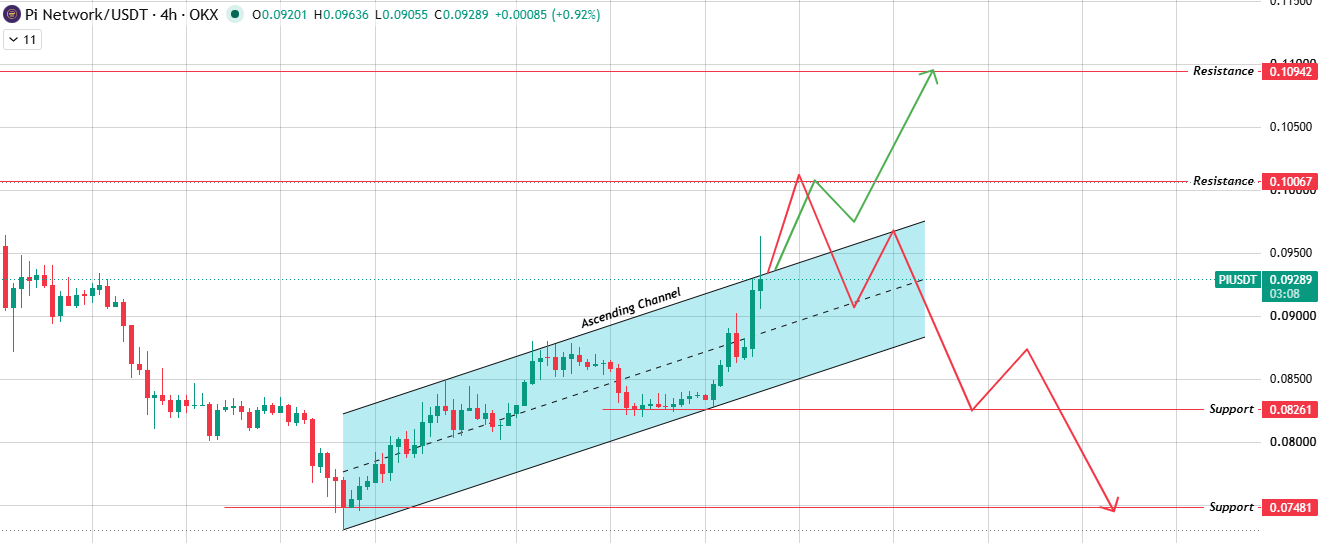
Source: Chart Taken From TradingView.
That's the line to watch. Clear it with real volume behind the move, and $0.10067 comes into play first, then $0.10942 further out.
But breakouts fail too, more often than traders like to admit.
If this one does and turns into a liquidity sweep instead, expect a pullback toward the channel again, and a channel breakdown would take price to $0.08261, maybe all the way to $0.07481.
Daily Chart Analysis of $PI
Switch to the daily chart , and there's a textbook ascending triangle sitting on the chart. Flat resistance up top at $0.10389. 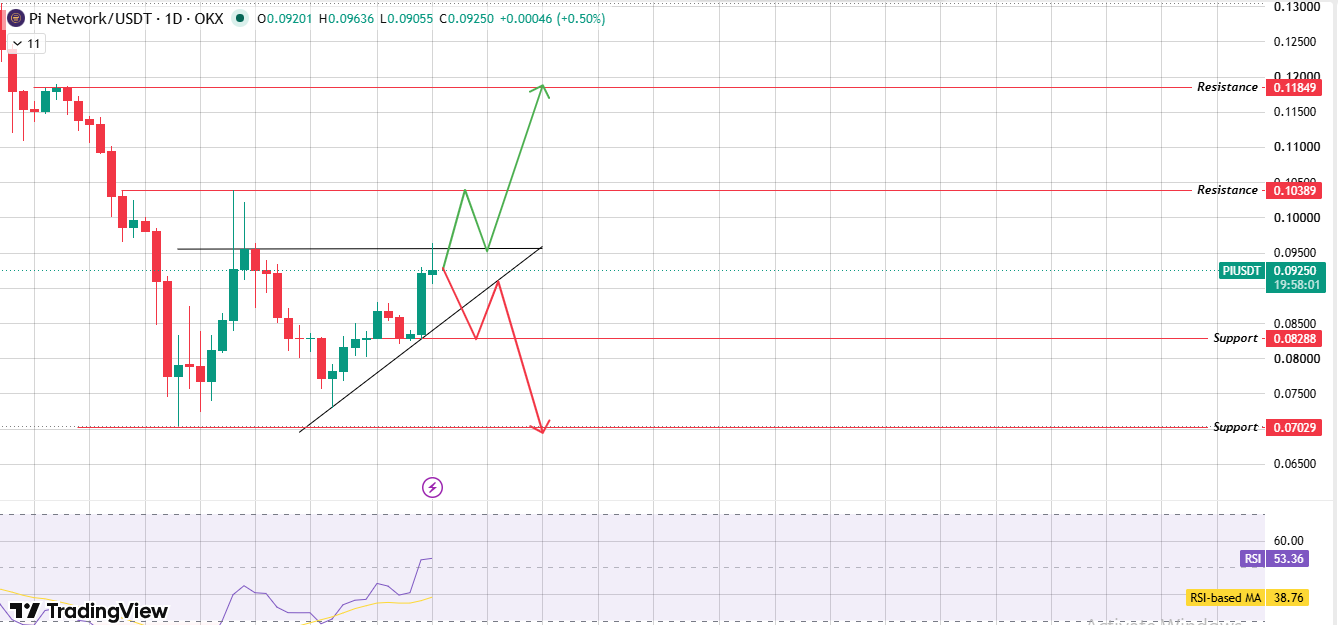
Source: Chart Taken From TradingView.
Underneath it, a rising trendline of higher lows, the kind of structure that usually (not always) resolves to the upside.
Break above that resistance with volume, and $0.11849 becomes the level.
Lose the trendline instead, and the price likely heads toward $0.08288, with $0.07029 as the next stop if things get messier.
Momentum-wise, RSI is reading 53.36 against a 38.76 moving average. Building strength, sure, but nowhere near overbought territory yet.
Bull, Base, and Bear Cases
Invalidation: the bull case fails if PI rejects hard at $0.10067 on the 4H chart without follow-through. The bear case is invalidated if buyers defend $0.08288 on repeated retests.
Analyst Forecasts
According to Coingabbar Market Research Analyst, crypto commentators covering the RoboPay news seem to agree on one thing: this reads more like genuine utility than another hype cycle.
Price and volume actually moved together, rather than the usual pump-and-fade pattern.
Chart watchers are less certain about direction from here, but most circle back to the same point.
Hold the current support zone, and this month's pi network price prediction stays constructive. Lose it, and that optimism evaporates fast.
Long-Term Outlook
Push past this month and the bigger question is simple: can real demand keep pace with supply hitting the market?
If partnerships like RoboPay keep landing and volume stays where it is, PI has a real shot at building a higher floor over time.
If unlocks outrun adoption instead, every recovery attempt just gets sold out again.
That's the tension defining this coin right now, and it isn't resolving in a week or two.
Risks
Any pi network price prediction carries real uncertainty, and PI has a few specific ones worth naming:
-
Heavy token unlock schedule against still-low circulating supply
-
Failed breakout risk if $0.10067 to $0.10389 resistance holds firm
-
Broader market weakness or rising BTC dominance dragging altcoins lower
-
Thin historical volume outside of news-driven spikes
Glossary
Ascending Channel: Two parallel trendlines sloping upward, with price bouncing between them, generally seen as a bullish setup.
Ascending Triangle: Flat resistance sitting above rising support. This one tends to break upward more often than not, though never guaranteed.
Liquidity Sweep: A quick stab through support or resistance that hunts stop losses before the price turns right back around.
Circulating Supply: However many tokens are actually out there trading, as opposed to sitting locked up.
FDV (Fully Diluted Valuation): What the market cap would look like if every last token, unlocked or not, were already in circulation.
Disclaimer: This article is for informational purposes only and does not constitute financial advice. Cryptocurrency markets are highly volatile. All price levels referenced are derived directly from TradingView chart data. Always conduct independent research before making investment decisions.


















