Bitcoin Forecast: Will 2026 Midterm Elections Threaten BTC’s $100K?


Bitcoin price today is near $83,300, up 0.4% on Wednesday. That is still below the eight-month high near $87,400.
Traders are split. Some see a pause before $100,000. Others fear a drop after the U.S. midterms.
This price update covers the data, the charts, and the key levels.
Bitcoin News Today: What Is Moving the BTC Price?
Three things are in focus right now. ETF flows, whale buying, and a key U.S. inflation reading.
A high inflation print can raise the odds of a rate hike. That lifts the dollar and weighs on risk assets. A low print can help crypto.
Metric | Latest Figure |
Price | About $83,300 |
Move on Wednesday | +0.4% |
Eight-month high | Near $87,400 |
ETF net inflow (Sept. 29) | $66.19 million |
IBIT inflow | $51.09 million |
Inflow streak | 9 trading days |
Whale holdings (10-10K BTC) | 13.64M BTC (67.93% of supply) |
Exchange supply | 1.325M BTC |
CryptoQuant Bull Score | 90 out of 100 |
Are Whales Buying BTC Right Now?
Yes, and in size. As per Santiment data, Wallets holding 10 to 10,000 coins added 41,025 coins in just 10 days, per Santiment.
Their total is now 13.64M coins, or 67.93% of the supply. That is the highest level since the mid-August rally.
Small wallets under 0.01 coins are mostly flat. Santiment's chart shows them sitting still since the $87K peak.
History says BTC often does better when big holders buy. It is not a guaranteed signal, though.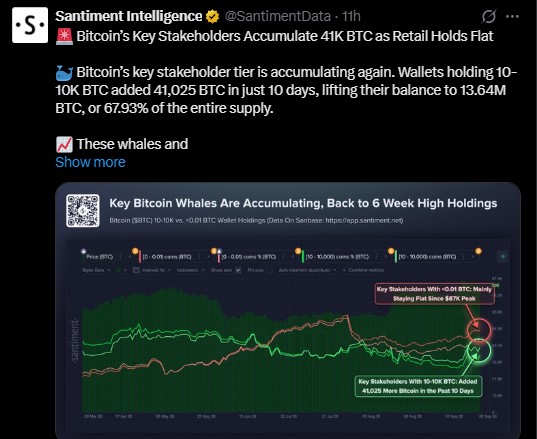
Is $BTC Supply on Exchanges Really Falling?
Santiment tested the claim that $2.4B of ETF inflows pulled BTC off exchanges. Its own data shows a smaller move.
Exchange supply fell about 35.8k coins from Sep 20 to 27, to 1.325M. The week before, exchanges gained almost 20k BTC.
Net, that is only about 15.9k coins off exchanges. Supply still sits above every July reading.
Sep 22 alone made up about 26.7k of the drop. More than half of last week's fall reversed the week before.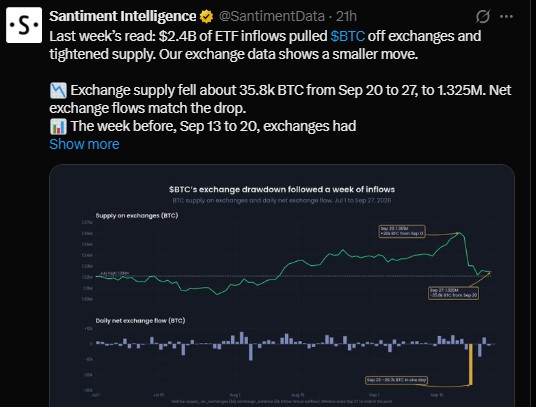
BTC News Today: Are ETF Inflows Still Strong?
U.S. spot ETFs took in $66.19 million on Sept. 29, according to SoSoValue. BlackRock's IBIT led with $51.09 million.
That marks nine straight trading days of net inflows.
But CryptoQuant says spot demand shrank by about 170,000 BTC over 30 days. Its Bull Score sits at 90 out of 100 after the coin broke above its 365-day moving average.
So the score is high while buying is fading. The signals are mixed.
Is This a Real Bull Market Signal?
Tom Lee of Bitmine says the coin moving above its 200-day moving average has happened 9 times in 12 years. Eight of those led to bull markets.
He expects heavy institutional buying in the fourth quarter.
Arthur Hayes has a much longer view. He says an AI spending bust could push BTC to $1 million within 10 years. That is a 10-year call, not a 2026 one.
Bitcoin Price Prediction: Do the Midterms Put BTC at Risk?
The U.S. midterm elections are on November 3, 2026. Bitcoin has struggled after past midterms.
Year | BTC Fall After Midterms | Q4 Result |
2010 | -72% | +391% |
2014 | -65% | -16.70% |
2018 | -52% | -42.16% |
2022 | -27% | -14.75% |
Four data points are a small sample. This does not prove the elections caused the drops. Still, it is worth watching.
If weakness follows, the short-term holder cost basis near $73,000 could act as support. In confirmed bull markets, this level has often held.
Bitcoin Price Forecast: Key Levels to Watch
Some traders see a double bottom on the chart. The coin tested it, found support, and is moving up again.
If $84,000 holds as support, the retest could give buyers an entry. The pattern target is $100,000. That is a chart target, not a promise.
Level | Why It Matters |
$100,000 | Double-bottom chart target |
$87,400 | Eight-month high |
$84,000 | Support to hold on a retest |
$83,300 | Current price area |
$73,000 | Short-term holder cost basis |
Bitcoin Price Prediction: Bull Case vs Bear Case
Bull case: whales keep buying, retail starts selling, ETF inflows continue, and $84,000 holds. Then $87,400 and $100,000 come into view.
Bear case: spot demand keeps fading, the inflation reading disappoints, or midterm weakness hits. Then $73,000 becomes the level to watch.
Nobody knows which path plays out. Watch whales, ETF flows, and $84,000 first.
Disclaimer
This article is for information only and is not financial advice. Crypto prices are highly volatile, and past performance does not guarantee future results. Do your own research, speak with a licensed financial advisor, and never invest more than you can afford to lose.











.webp)











