Pi Network Price Prediction September 2026: Is $0.41 Really Possible?


Pi Network started life back in 2019 as a mobile mining app, letting users earn PI just by tapping a button once a day, long before the coin ever had an open market price.
It finally moved to a fully tradable mainnet years later, and the chart has been finding its footing ever since. $PI is currently trading at $0.09047, up modestly on the day.
Anyone running a Pi Network price prediction September 2026 today search wants to know whether this recent channel breakout is the start of something bigger or just a bounce inside a longer downtrend.
Price Today: Live Data and 24-Hour Change
Metric | Value |
Price | $0.09047 |
24H Change | +1.6% |
24H Range | $0.08774 - $0.09078 |
Market Cap | $1.004B |
Fully Diluted Valuation | $1.544B |
24H Trading Volume | $6.071M |
Circulating Supply | 11.092B |
Total Supply | 17.064B |
Max Supply | 100B |
The gap between circulating supply and max supply is the standout number here.
With only about 11% of the eventual total in circulation, PI carries a heavier long-term dilution overhang than most large caps, something worth weighing against any Pi network price prediction September 2026 analysis that leans purely on chart structure.
Source: MarketCap data taken from Coingecko, data as of Aug 25, 2026. Figures may vary slightly across other tracking websites.
Key Takeaways
PI trades at $0.09047, up 1.6% on the day but down 2.7% against Bitcoin.
The weekly chart shows the price breaking out of a multi-month descending channel and now consolidating just above the breakout zone.
A Wolfe Wave structure on the same chart points toward first resistance at $0.19960 if momentum carries through, with a longer-term completion zone near $0.41.
Rejection at that first resistance would send the price back toward support near $0.08584.
Circulating supply is just 11.092B out of a 100B max supply, so a large share of future PI has yet to enter the market, a real dilution factor for any PI network price prediction September 2026 update.
Technical Analysis: Weekly Channel Breakout
PI spent recent months sliding inside a descending channel after topping out earlier in the year, each bounce capped by the falling upper boundary.
That channel finally broke, and the price is now consolidating just above the old boundary rather than immediately reversing back into it. 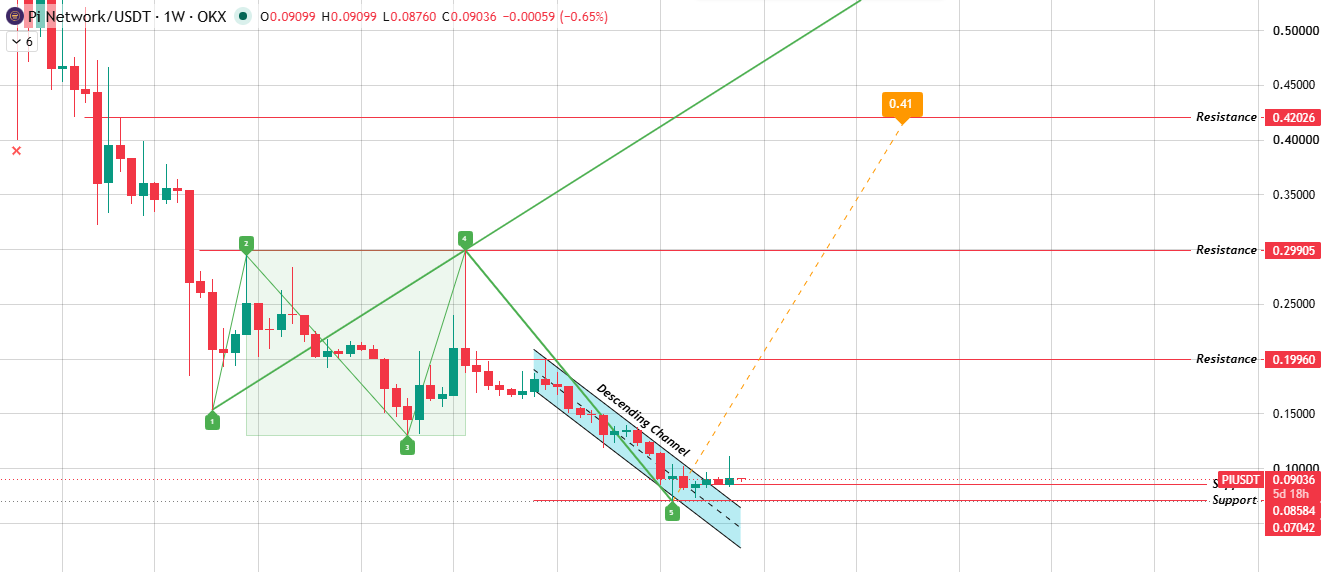
Source: Chart Taken From TradingView.
Consolidation right after a breakout is normal; it's the market deciding whether the move has real conviction behind it or whether it needs to retest lower before trying again.
Wolfe Wave Pattern
The same chart carries a Wolfe Wave structure, a five-point pattern used to project where price is likely headed once it clears its immediate range.
Here the projection points well above the current price, with the first real test sitting at the $0.19960 resistance.
Clear that with volume and the path opens toward $0.29905 and eventually the Wolfe Wave's full completion zone near $0.41.
Get rejected at the first resistance instead, and the more likely path is back down toward the support levels below.
Technical Analysis: Key Support and Resistance
Level Type | Price |
Resistance 3 | $0.42026 |
Resistance 2 | $0.29905 |
Resistance 1 | $0.19960 |
Support 1 | $0.08584 |
Support 2 | $0.07042 |
Pi Network Prediction September 2026: Bull, Base, and Bear Cases
Scenario | Level | Setup | Invalidation |
Bull | $0.12 - $0.19960 | Weekly consolidation resolves upward; momentum from the channel breakout carries price toward the first marked resistance. | Weekly close back below $0.08584 |
Base | $0.0858 - $0.12 | Price stays range-bound just above the breakout zone while the market waits for a volume trigger to confirm direction. | Extended chop without a decisive weekly close on either side |
Bear | $0.08584 - $0.07042 | Consolidation fails, the price breaks back below the recent channel breakout, and it retests lower support. | Reclaim and weekly close above $0.09078 |
On-Chain and Fundamental Drivers
PI's fundamentals lean on a very different structure than most large-cap coins.
Market cap sits at $1.004B based on circulating supply, but fully diluted valuation already runs to $1.544B once the full 17.064B total supply is counted, and that's still far short of the 100B max supply written into the protocol.
Daily trading volume of $6.071M is thin relative to the market cap, which means liquidity is a real factor here; thinner books tend to produce sharper moves in both directions compared to more heavily traded assets.
September Catalysts That Could Move the Price
Continued mainnet adoption and exchange listing news remain the biggest swing factors for PI, since the network's utility story is still being built out in real time.
Broader sentiment toward newer, still-maturing coins tends to move PI more than fundamentals alone, given how young its open market history actually is.
Community-driven trading activity around KYC completion and wallet migration milestones has historically added short bursts of volume.
None of these are guaranteed to land in September; they're simply the themes worth watching alongside the chart.
What Analysts Are Forecasting
Chart-focused traders are treating the channel breakout as an early positive signal rather than a confirmed trend reversal, mainly because the consolidation since the breakout hasn't produced a strong follow-through candle yet.
The general read is that $0.19960 is the level that actually tells the story; clear it with real volume, and the Wolfe Wave thesis gains serious weight.
Stay capped below it, and PI likely spends more time building a base before any bigger move happens.
Long-Term Outlook: 2027 to 2030
The Wolfe Wave's full projection points toward the $0.41 to $0.42026 zone, but getting there requires clearing two resistance levels in sequence first, not just the immediate one.
Treat this as a multi-year roadmap rather than anything actionable this quarter.
If PI clears $0.19960 and later $0.29905 with sustained volume behind each move, the $0.41 zone becomes a realistic multi-year target.
If either level caps the price for an extended stretch, the more conservative base case simply holds for longer.
Risks That Could Invalidate This Forecast
The single biggest structural risk here is supply. With less than a third of total supply and only about 11% of max supply currently circulating, ongoing unlocks could weigh on price even if the chart pattern plays out as expected.
On the technical side, failure to clear $0.19960 with real volume keeps the current bullish read stuck at the consolidation stage.
Thin daily volume relative to market cap also means PI can see outsized moves on relatively small trading activity, in either direction.
How to Buy and Store It Safely
PI trades on a growing number of exchanges, though liquidity varies more than it does for longer-established coins, so checking order book depth before a large trade is worth the extra minute.
For storage, small trading amounts are fine on an exchange, but larger holdings are safer on a hardware wallet or the network's own official wallet app.
Enable two-factor authentication everywhere, and never share a seed phrase or passphrase with anyone claiming to be support.
Glossary
Descending channel: Two parallel falling trendlines bounding the price until it breaks one side.
Wolfe Wave: A five-point pattern used to project a breakout's likely completion target.
Resistance: A level where selling has historically capped price.
Support: A level where buying has historically stepped in.
Circulating supply: The portion of the total token supply currently available and tradable on the open market.
Methodology
This Pi Network price prediction September 2026 explained piece is built from weekly chart structure, live market data, and standard technical tools, including channel analysis and Wolfe Wave projection.
Every scenario includes a clear invalidation level so readers can track whether the thesis still holds as new candles print.
Disclaimer: This article is for informational purposes only and does not constitute financial advice. Cryptocurrency markets are highly volatile, and prices can move sharply in either direction without warning. Always do independent research and consult a licensed financial advisor before making investment decisions.

















