Pi Network Price Prediction 2028: Can PI Hit $1 or Fall to $0.01?


Pi Network Price Prediction 2028: Can PI Reach $1 or Fall to $0.01?
What if Pi Network's toughest test isn't next week but the year after every roadmap item ships?
Pioneers have spent days arguing over Protocol 28 and OUSD. Fair enough.
But a slower clock runs underneath. Billions of tokens still wait. To unlock, batch by batch. Demand hasn't proven it can absorb them. And that gap grows quietly.
Pi Network Price Prediction 2028: Where $PI Trades Today
Any $PI Network price prediction 2028 starts with today's reading, and CoinMarketCap data, October 14, 2026, 09:30 UTC, puts $PI at $0.07949, down 1.05% in 24 hours.
Metric | Value |
Price | $0.07949 |
24h change | -1.05% |
Market cap | $893.75M |
24h volume | $3.59M |
FDV | $7.95B |
Market cap is price multiplied by circulating coins. FDV (fully diluted valuation) prices every future coin at today's rate.
Volume fell 44.85% in a day. Thin trading.
$PI Circulating Supply: The Number Behind Every Target
Dashboard metrics list $PI circulating supply at 11.24B. Against a 100B maximum. That means coins counted as live in the market. But 6.06B of that stays locked. Only 5.18B sits unlocked, roughly 46%.
Effective total supply reads 17.30B. And FDV swings from $7.95B on CoinMarketCap to $1.38B on OKX, depending on the supply base each platform picks.
Earlier, a Pi lockup and supply breakdown explained how the locks work.
Exchange Liquidity: Where $PI Actually Trades
OKX leads with 36.17% of volume, about $1.31M a day.
Order books are shallow. About $100,374 within 2% above price. And $122,778 within 2% below. So what happens when the next unlock meets a market this thin?
New venues from exchange listing updates would widen the base, though no new venue appears in this data.
Pi Core Team on Stablecoins: What Changes for $PI
The Pi Core Team post says stablecoins could expand utility where price stability matters.
It adds that simply introducing one doesn't guarantee a fit with Pi. Integration design decides that. And that's the demand question. Stablecoin activity must preserve utility for $PI itself, or the Pi Network future price story weakens.
Roadmap Update: What Could Land Before 2028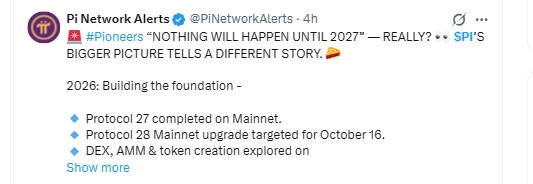
Protocol 28 Mainnet upgrade: targeted for October 16. Two days out. Protocol 27 is complete. DEX, AMM and token creation sit in Testnet exploration.
A community roadmap summary also lists a DEX for Q1 2027 and quantum-resistant security later that year. The post warns that community timelines aren't guarantees. Worth remembering.
$PI Technical Analysis: Falling Wedge on the Daily Chart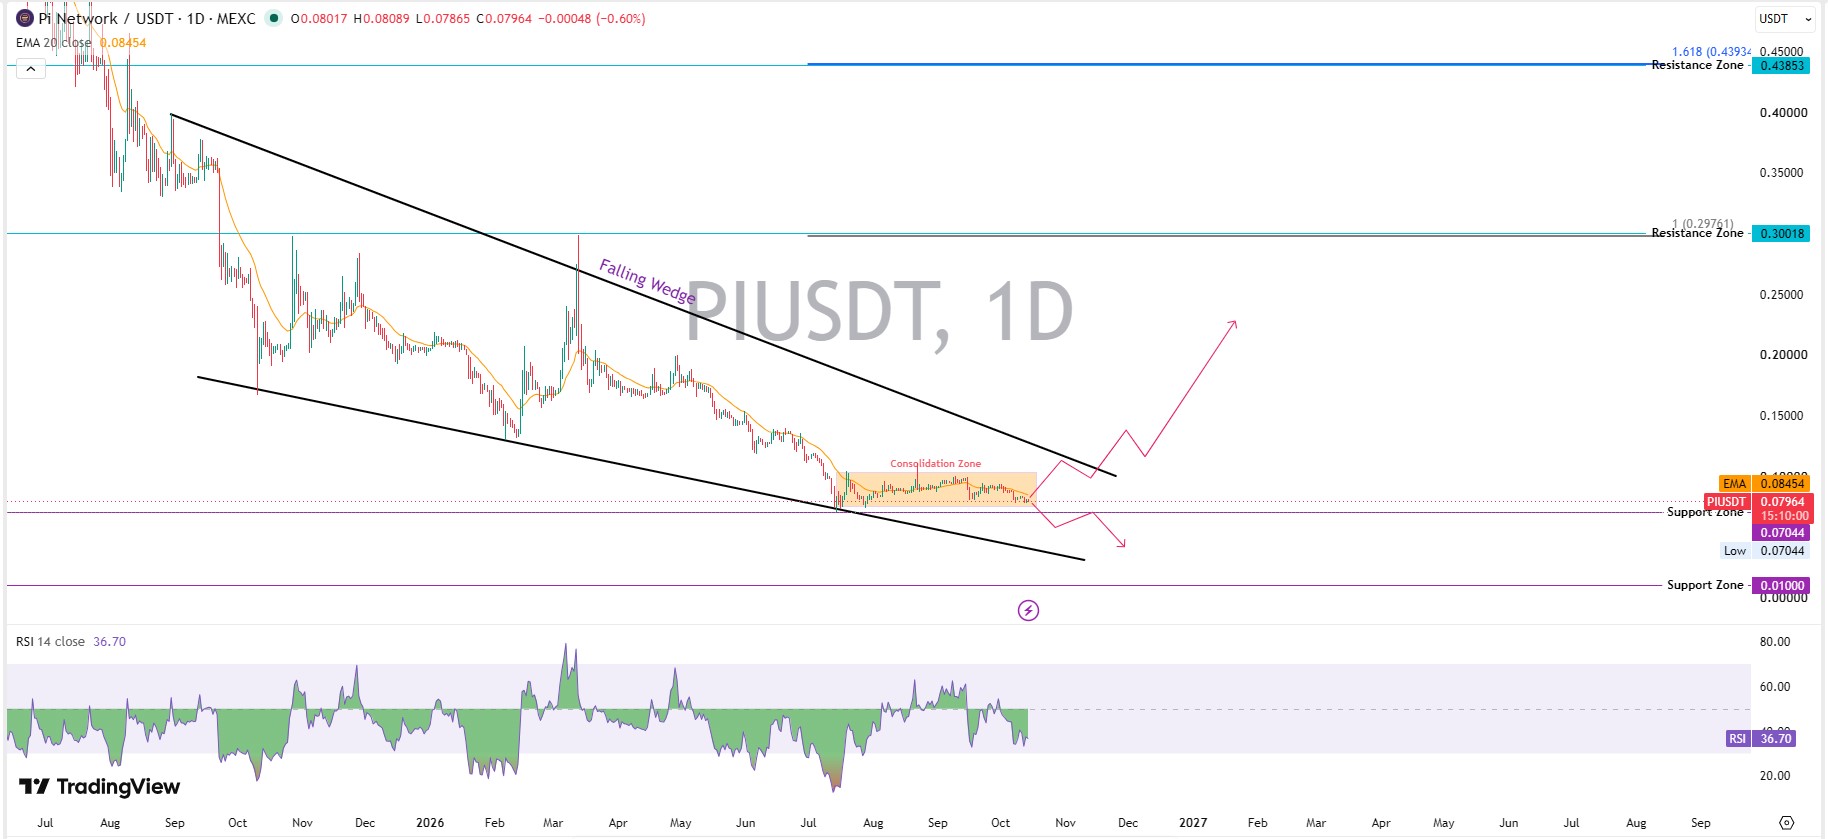
The TradingView daily chart shows $PI at $0.07964 on MEXC, inside a day range of $0.07865 to $0.08089. Price has chopped sideways in a consolidation zone since July.
A falling wedge is two downward lines narrowing together. It often precedes an upward breakout, but only after price actually leaves the pattern. That reads bullish at first. Actually, scratch that: nothing counts until price breaks out.
RSI reads 36.70. Below 50 shows sellers hold momentum, yet it sits above the 30 oversold line.
The 20-day EMA, a trend line weighting recent trades, sits at $0.08454, about 6.15% above price. Reclaiming it would be the first real buyer signal. Current $PI technical analysis keeps a bearish bias until then.
Monthly Chart: How Far $PI Has Fallen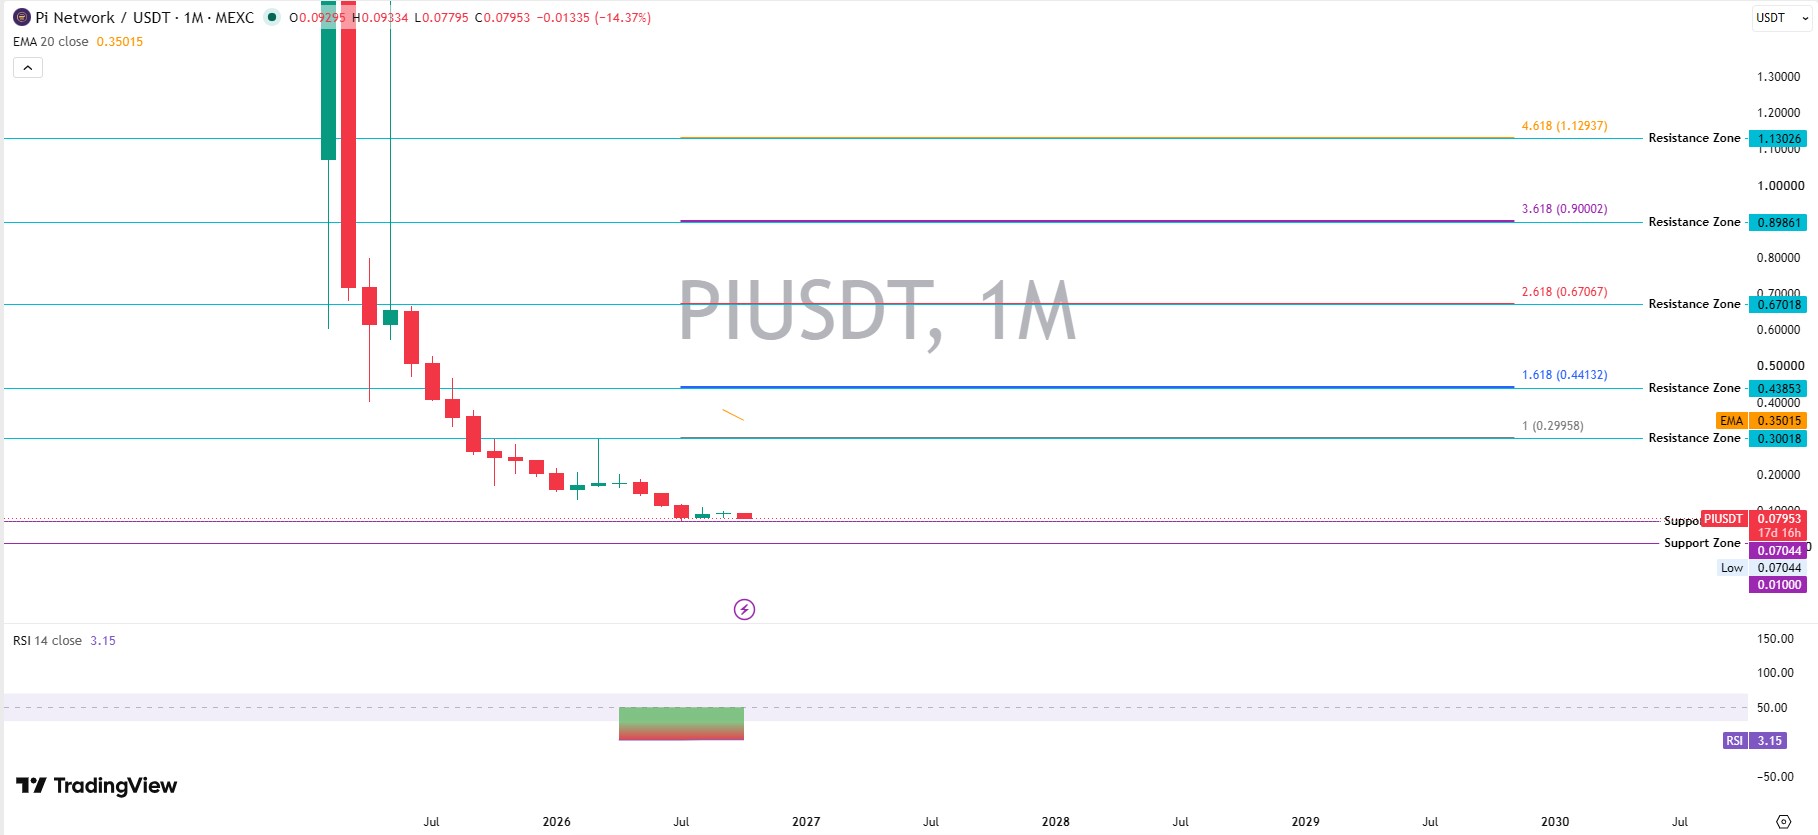
Monthly candles show $PI near $0.07953, down 14.37% in October's session so far. The 20-month EMA sits far above at $0.35015.
CoinMarketCap lists an all-time high of $2.98 in February 2025, a 97.32% drop. Today's price is 12.79% above the mid-July low of $0.07072. Bitcoin comparisons keep circulating, as this Bitcoin path discussion shows.
$PI Support and Resistance: Key Levels
Level | Type | Move from $0.07949 |
$1.13026 | Resistance | +1,321.9% |
$0.43853 | Resistance | +451.7% |
$0.30018 | Resistance | +277.6% |
$0.07044 | Support | -11.4% |
$0.01000 | Support | -87.4% |
$PI support and resistance zones from the monthly chart stack far above price. The nearest hurdle sits at $0.30018. A Protocol 28 rally case only works if $0.07044 holds.
Can Pi Network Reach $1? The Market Cap Math
Reaching $1 with 11.24B circulating $PI implies an $11.24B market cap, about 12.6 times today's $893.75M. At 17.30B effective supply, that's $17.30B.
So can Pi Network reach $1 by 2028? Only with billions in fresh demand. And the chart shows none yet.
Dogecoin trades at $0.08528, almost level with $PI per coin, so price alone proves nothing. Attention rotates fast, as meme coin news shows.
Bear Case: Slide Toward $0.01000
Under this scenario, $PI could trade between $0.01000 and $0.07044 if the wedge breaks lower.
Invalidation: reclaiming the 20-day EMA with rising volume. Dates on the crypto events calendar may add noise either way.
Base Case: Range Between $0.08 and $0.15
The base Pi Network forecast 2028 leans toward $0.08 to $0.15, if upgrades hold user activity steady and unlock stays manageable. That's a market cap near $0.90B to $1.69B. Don't expect fireworks. $PI barely moved after earlier headlines either.
Bull Case: $0.30018 to $0.43853
The bull $PI price prediction 2028 reaches $0.30018 to $0.43853 if a DEX launches, stablecoin plans add real usage, and buyers absorb unlocked supply. That means a $3.37B to $4.93B market cap.
Invalidation: repeated rejection at $0.30018. Capital chases narratives, and AI crypto news shows what competes for it.
Final Takeaway on Pi Network Price Prediction 2028
Bias stays bearish until the wedge resolves upward. Any Pi Network price prediction 2028 near $0.08 to $0.15 fits the evidence best.
But $0.30018 isn't fantasy. It just needs demand, and more crypto price forecasts will track whether it arrives.
Disclaimer: This article is for informational purposes only and isn't financial advice. Crypto markets are volatile. Readers should research independently before making any trading decisions involving $PI.