Bonk Price Prediction 2050: From the Ashes, Can $BONK Rise Again?

Bonk's been sitting quietly near its cycle low for a while now, close enough to where it started that most casual observers have stopped checking in.
But the monthly chart is showing something worth a longer look: a swing low that's basically holding, a Fibonacci ladder stacked cleanly above, and a price that hasn't broken down any further in some time.
That's the setup behind this Bonk price prediction 2050 built off the chart's actual levels, not a guess at what the number "should" be.
Where BONK Sits Right Now
BONK is trading around $0.00000408, essentially right on top of its swing low at $0.00000406.
Support sits just below at $0.00000390, with a deeper floor at $0.00000264 if things slip further.
There's not much room between the current price and the bottom of this range, which is exactly why the next move matters so much.
That tight positioning near the base is the whole starting point here. Everything above is Fibonacci territory PEPE and $BONK alike need real momentum to reach.
The Fibonacci Ladder Above
From the swing low, the retracement levels mapped toward the prior high lay out a clear path:
| Level | Price | What It Represents |
|---|---|---|
| Resistance 1 | $0.00002284 | First real test above the base |
| 0.5 Fib | $0.00003320 | Psychological halfway point |
| 0.618 Fib | $0.00004007 | Would suggest a genuine trend shift |
| 0.786 Fib | $0.00004986 | Resistance zone just under full retracement |
| 1.0 Fib | $0.00006233 | Full retracement to the prior cycle high |
| 1.618 Extension | $0.00009835 | First major long-term bullish target |
| 2.618 Extension | $0.00015663 | Deep extension for a genuine multi-cycle run |
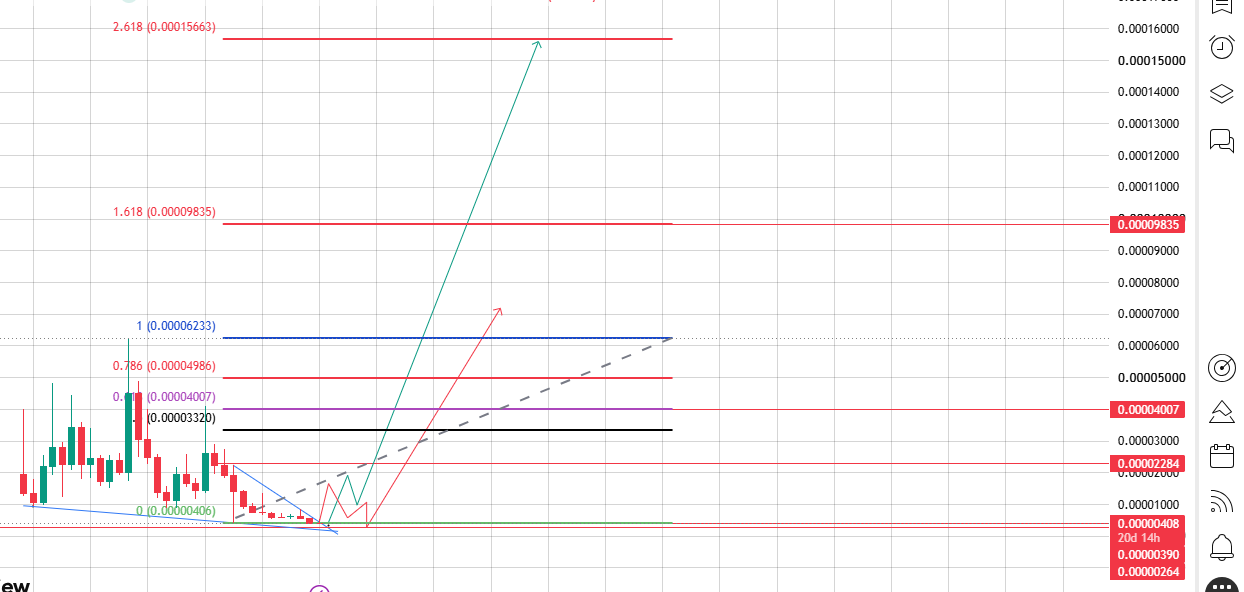
Source: Chart Taken From TradingView
Getting from current price to just Resistance 1 is already a jump of more than 5.5x. Clearing the full ladder up to the 2.618 extension would mean roughly a 38x move.
None of that happens without sustained demand across multiple market cycles, not a single pump.
The Near-Term Path: Bonk Price Prediction 2050
Short-term, everything comes down to whether $BONK can hold this base and start climbing without breaking $0.00000390.
If that holds through 2026, Resistance 1 at $0.00002284 becomes the first real target.
Push through 2027 and 2028 with support from Solana's broader ecosystem growth, and the 0.5 and 0.618 Fib levels, $0.00003320 and $0.00004007, come into view.
By 2030, reclaiming the 1.0 Fib at $0.00006233 would mark a full retracement back to $BONK's prior cycle high, something like a 15x move from where it sits today.
That's the kind of run that needs a real meme-coin season behind it, not just chart mechanics.
Bonk Price Prediction 2035–2040: Extension Territory
Beyond 2030, this becomes less about short-term momentum and more about whether $BONK holds its spot as Solana's flagship meme coin while ongoing burns keep working against its 88.87 trillion token supply.
Clearing the 1.0 Fib zone and pushing into the 1.618 extension at $0.00009835 would be one of the stronger multi-year recoveries a Solana-native token has managed.
Expect that path to be uneven; sharp pullbacks along the way are close to a given based on BONK's volatility history.
By 2040, a range between the 1.618 and 2.618 extensions, roughly $0.0000984 to $0.000157, is a realistic window if burns and ecosystem growth both keep pace.
Bonk Price Prediciton 2050: A Scenario Exercise, Not a Forecast
Anything projected 24 years out has to be treated as a range of outcomes, not a single confident number.
Bearish scenario: BONK loses relevance as newer Solana meme tokens take its spot, support around $0.00000390 eventually fails, and price drifts back toward $0.0000015–$0.000003.
Base scenario: BONK holds its position as Solana leading community token, burns keep chipping away at supply, and price settles somewhere in the 1.618–2.618 Fib zone, roughly $0.0001 to $0.00016.
Bullish scenario: BONK becomes one of the rare meme coins that keep compounding relevance across decades, backed by continued Solana growth, aggressive multi-decade burns, and repeated meme-coin cycles pulling in fresh capital.
In this extreme case, price could stretch well past the 2.618 extension toward roughly $0.0004 by 2050.
Against $BONK's 88.87 trillion token supply, that implies a market cap near $35.5 billion, but within the range of what a genuinely dominant, long-running crypto asset could plausibly command over that kind of timeframe.
It's a long-shot ceiling, not something to plan around.
Bonk Price Prediction Target Table
| Year | Bear Case | Base Case | Bull Case |
|---|---|---|---|
| 2026 | $0.0000015 | $0.00000408 | $0.00002284 |
| 2030 | $0.0000020 | $0.00004007 | $0.00006233 |
| 2040 | $0.0000015 | $0.00007000 | $0.00009835 |
| 2050 | $0.0000010 | $0.00013000 | $0.00040000 |
Treat the upper end of this range as a long-shot scenario, not an expectation. These numbers trace back to the chart's own structure and BONK's known supply, not arbitrary guesses.
What Could Actually Move the Needle
Support at $0.00000390 holding is the first thing to watch. Lose it, and everything above becomes a lot less relevant for a while.
Ongoing burns matter because BONK's supply is enormous. Every burn campaign that removes tokens permanently is one of the only structural forces working in the bull case's favor.
Solana's own growth drags BONK along with it more than almost anything else.
A thriving Solana ecosystem tends to mean more attention, more liquidity, and more reasons for BONK specifically to stay relevant.
Broader crypto cycles still set the tone. Bitcoin and Ethereum bull runs tend to be what pulls fresh capital into meme coins in the first place.
Community persistence is the wildcard that's hardest to chart. BONK's fair-launch airdrop built a genuinely large early holder base; whether that community sticks around for another two decades is impossible to know in advance.
Final Thoughts
BONK's chart right now is a coin sitting almost exactly where it started, with a long Fibonacci ladder mapped out above and no confirmation yet that it's ready to climb it.
The setup is there. The proof isn't, not yet.
Stretching this out to 2050 means accepting a wide spread of outcomes instead of one clean number. This Bonk price prediction 2050 breakdown is a research starting point, not financial advice.
Meme coins live and die on community energy as much as chart structure, and two and a half decades gives both plenty of time to shift in either direction.
Disclaimer: This article is for informational purposes only and should not be considered financial advice. Cryptocurrency investments, especially in high-volatility meme coins like BONK, carry significant risk of loss. Always do your own research before investing.