PONS Price Projection: Fresh High, 58% Spike, What Comes Next?


Something shifted for this Robinhood-linked token in the last 24 hours, and traders who blinked missed the move. A quiet launchpad name suddenly turned into one of the loudest tickers on crypto screens this morning. The kind of jump that makes you sit up, check the chart twice, then wonder if you are already late to the party. There is a story behind the move, and it is not just hype. What actually pushed this token into the spotlight, and does it have legs?
PONS Price Prediction: Why Everyone Is Suddenly Watching This Token
PONS price projection conversations picked up fast once the token ripped higher in a single session. It's not every day a small-cap launchpad token doubles attention overnight.
Something changed in the background. The project's treasury made a move that caught traders off guard.
Turns out, the timing lined up with a broader shift toward tokenized stocks. And that combination, a fresh narrative plus a violent green candle, tends to pull in momentum traders fast.
We pulled up the chart right after the spike, and the first thing that stood out was how orderly the structure still looked. No wick-heavy chaos. Just steady buying.
But is this sustainable or a one-day wonder? That's the question this piece tries to answer, using the latest data instead of guesswork.
Why Is the $PONS Price Moving Today?
One of the key catalysts appears to be the team's August 22 announcement. The Pons team said its treasury started supplying liquidity to on-chain real-world assets, aiming to become the leading ecosystem for stock tokens, and framed the project as the home of memestocks. Traders read that as a real usage signal, not just marketing.
PONS price prediction searches spiked alongside the announcement. Basically, the market decided a launchpad token tied to Robinhood Chain and tokenized equities deserved a re-rating.
And it wasn't just retail chatter. Volume followed the narrative, with PONS trading pairs seeing real depth instead of a thin pump.
For more on how this compares with an earlier setup, the RWA-driven surge coverage walks through the first leg of this move.
Here's the thing: RWA narratives have been the strongest theme this cycle. A token positioning itself there, on a chain backed by a major brokerage, gets extra attention almost by default.
Traders keeping an eye on fresh listings can also check the latest exchange listing updates for where $PONS might trade next.
$PONS Price Right Now: Live Market Snapshot
CoinGecko Data
PONS is trading near $0.06705, up 58.5% over the past 24 hours. The day's range stretched from $0.03788 to $0.07117, a wide band that shows just how fast this moved.
Market cap sits around $48.26 million, with a fully diluted valuation near $67.5 million. The circulating supply is 714.95 million tokens against a 1 billion max supply.
Onchain and DEX Data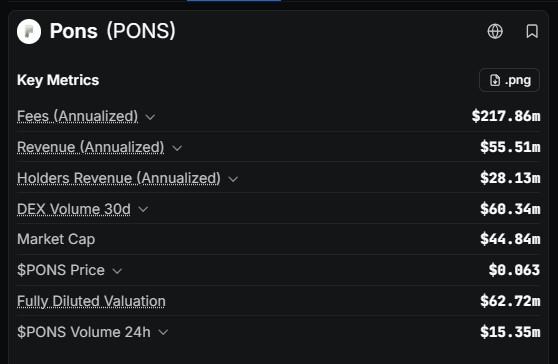
DefiLlama's PONS protocol dashboard shows annualized fees near $217.86 million and annualized revenue around $55.51 million, with holders capturing roughly $28.13 million of that. Thirty-day DEX volume runs about $60.34 million.
That's a meaningful fee base for a token this size. It suggests real transaction activity, not just speculative wrapping.
Exchange and Chain Data
On Robinhood Chain, PONS is an ERC-20 contract with 28,658 holders and over 2.6 million transfers.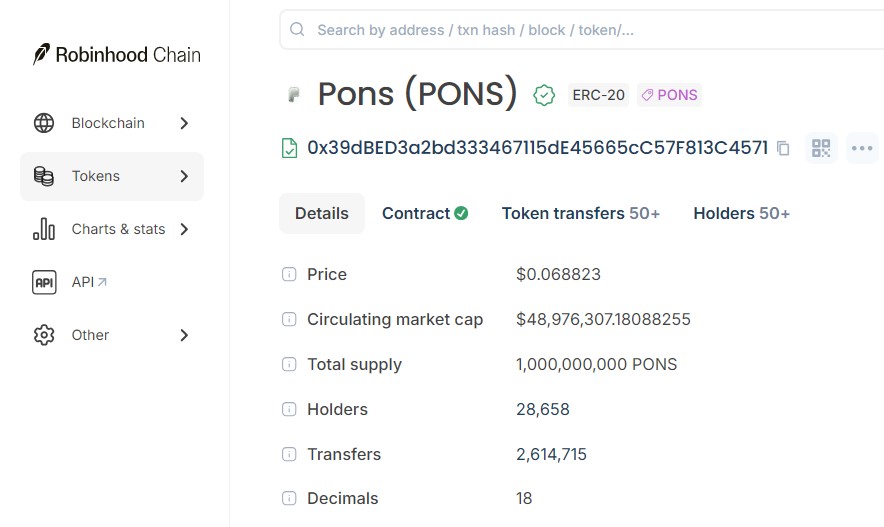
Trading volume leans heavily toward LBank, which handled roughly $5.94 million, well ahead of MEXC and BingX. The earlier Robinhood launchpad surge breakdown covers why that listing mix matters for liquidity.
PONS Chart Analysis: Daily Timeframe
The daily chart on TradingView charts shows $PONS breaking out of a well-defined ascending channel that had held since mid-July. Trades pushed clean through the upper channel boundary near the $0.060 to $0.070 zone, confirming bullish structure rather than a fakeout.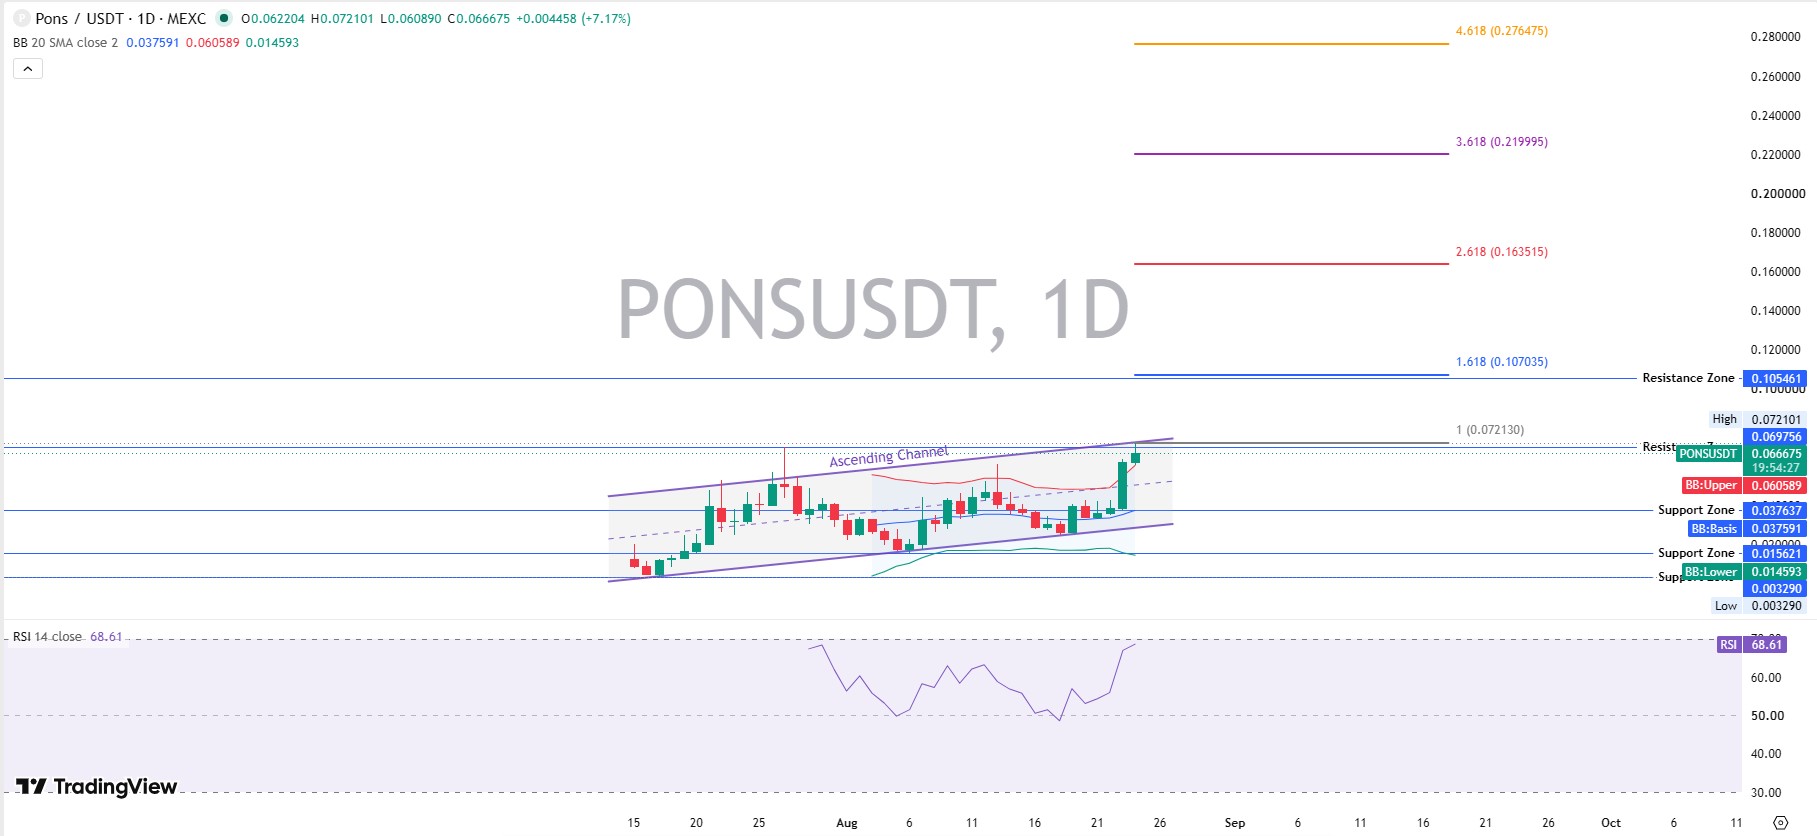
RSI 14 sits at 68.61, warm but not yet in extreme overbought territory. That leaves some room before momentum traders start taking profit aggressively.
Bollinger Bands widened sharply, with the basis near 0.0376 and the upper band trailing well below current trades, a sign volatility expanded faster than the bands could adjust. Fibonacci extensions drawn from the recent swing put resistance at $0.107035 (1.618), $0.163515 (2.618), and further out at $0.219995 and $0.276475.
Support now stacks at $0.037637, then 0.015621, with the prior low near $0.003290 acting as a deep floor. This is where PONS technical analysis gets interesting: the structure still favors bulls as long as trades hold above the mid-channel zone.
The earlier support and resistance breakdown mapped these same zones before the breakout was confirmed.
Altcoin Market Context: Where PONS Fits
PONS trades as part of the broader altcoin and RWA-linked token complex, not a pure memecoin, even though its own messaging leans into the meme stock branding.
That dual identity matters. It pulls in both narrative traders chasing the meme angle and fundamentals-driven buyers watching the RWA sector news around regulatory clarity.
The team's own announcement on X leaned hard into the meme stock framing, which is worth reading in full context rather than secondhand.
Altcoins tied to real infrastructure, rather than pure speculation, tend to hold gains longer after a spike. Traders comparing this to pure memecoin market coverage will notice $PONS behaves closer to an infrastructure play. Whether PONS fits that mold long-term is still unproven, but the fee and revenue numbers so far argue in its favor.
PONS Price Projection: Bear, Base, and Bull Scenarios
Timeframe | Bear Case | Base Case | Bull Case | Probability | Invalidation |
7 Days | $0.048 | $0.066 | $0.088 | Bear 35% / Base 45% / Bull 20% | Daily trades drop below $0.0376 support |
30 Days | $0.035 | $0.075 | $0.107 | Bear 30% / Base 45% / Bull 25% | Extended trading under $0.0156 zone |
Early 2027 | $0.020 | $0.090 | $0.163 | Bear 25% / Base 45% / Bull 30% | Loss of RWA narrative or drop toward $0.0033 |
What Could Invalidate the Bullish PONS Forecast?
Nothing here is guaranteed, and that's worth saying plainly. A move this sharp, 58% in a day, often cools off before it continues. The wide swing shows up clearly on CoinGecko's historical price data too.
If trades fall back under the $0.0376 support zone, the ascending channel breakout gets questioned fast. That would flip the near-term PONS price forecast toward the bear case.
Supply is also worth watching. With only 714.95 million of 1 billion tokens circulating, unlock events down the road could pressure price regardless of demand. Keep an eye on the token unlock and events calendar for anything scheduled.
And regulatory shifts around tokenized stocks, the whole reason PONS caught fire, cut both ways. Positive news lifts it. Negative news erases the premium fast.
Conclusion: PONS Price Projection Going Forward
This PONS price prediction leans cautiously bullish, not blindly bullish. The breakout looks real, the fee numbers back up the narrative, and RSI still has room before it flags exhaustion.
But a 58% single-day move rarely goes in a straight line. Expect a chop before the next leg, if there is one.
Traders watching the earlier ascending channel piece already saw this setup building. This update just confirms the breakout played out.
The latest crypto news today also helps put this move in a wider market frame.
The chart did the talking today. Whether it keeps talking is the real question.
Disclaimer: This article is for informational purposes only and does not constitute financial, investment, or trading advice. Cryptocurrency prices are highly volatile, and past performance does not guarantee future results. Always do your own research and consult a licensed financial advisor before making investment decisions.
Data snapshot as of 10:15 UTC, August 24, 2026, sourced from CoinGecko, CoinGlass, DefiLlama, and the Robinhood Chain block explorer.












.webp)




