Uniswap Price Prediction: Can UNI Breakout Hit New High! Reason Behind


Uniswap trades near $9.0427, and one trader says the coin must break above $9.68 before the trend turns bullish. That level sits about 7% above price.
This Uniswap price prediction covers that trigger, the latest liquidation data, and the chart levels for October 2026.
Uniswap Liquidation Data: Longs Took 74% of 24h Losses
Liquidation means a leveraged futures position is closed by force when the trader's margin runs out. Long positions bet on a rise and are liquidated when the price falls. Short positions bet on a fall.
Timeframe | Total Liquidated | Long | Short |
1h | $810.12 | $810.12 | $0 |
4h | $246.41K | $246.13K | $289.70 |
12h | $321.14K | $252.08K | $69.06K |
24h | $370.21K | $274.56K | $95.65K |
Table caption: futures liquidation data from Coinglass, checked October 5, 2026. Spot volume is tracked separately.
Long traders lost $274.56K of the $370.21K total over 24 hours. Most of that happened in the last 4 hours, when Longs lost $246.13K, and that fits the small dip on the chart. The amounts are small for a coin of UNI's size, so they point to a mild shakeout.
Uniswap News: CW Says UNI Must Break Above $9.68 to Turn Bullish
CW posted on X that UNI must break above $9.68 to shift back into a bullish trend. The post includes a chart with shaded zones above and below the price.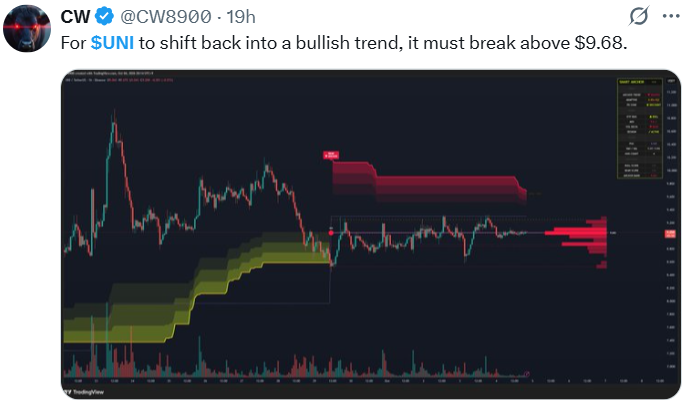
Source: Data From X
CoinGabbar could not independently verify how those zones are calculated. The $9.68 level does not appear on the chart below, so this article treats it as CW's view and not as a chart level.
Uniswap Price Prediction Chart: Technical Analysis
On the 4-hour chart, UNI is trading near $9.0427, up 2%, and broke a descending trendline resistance and price is consolidating above the trendline.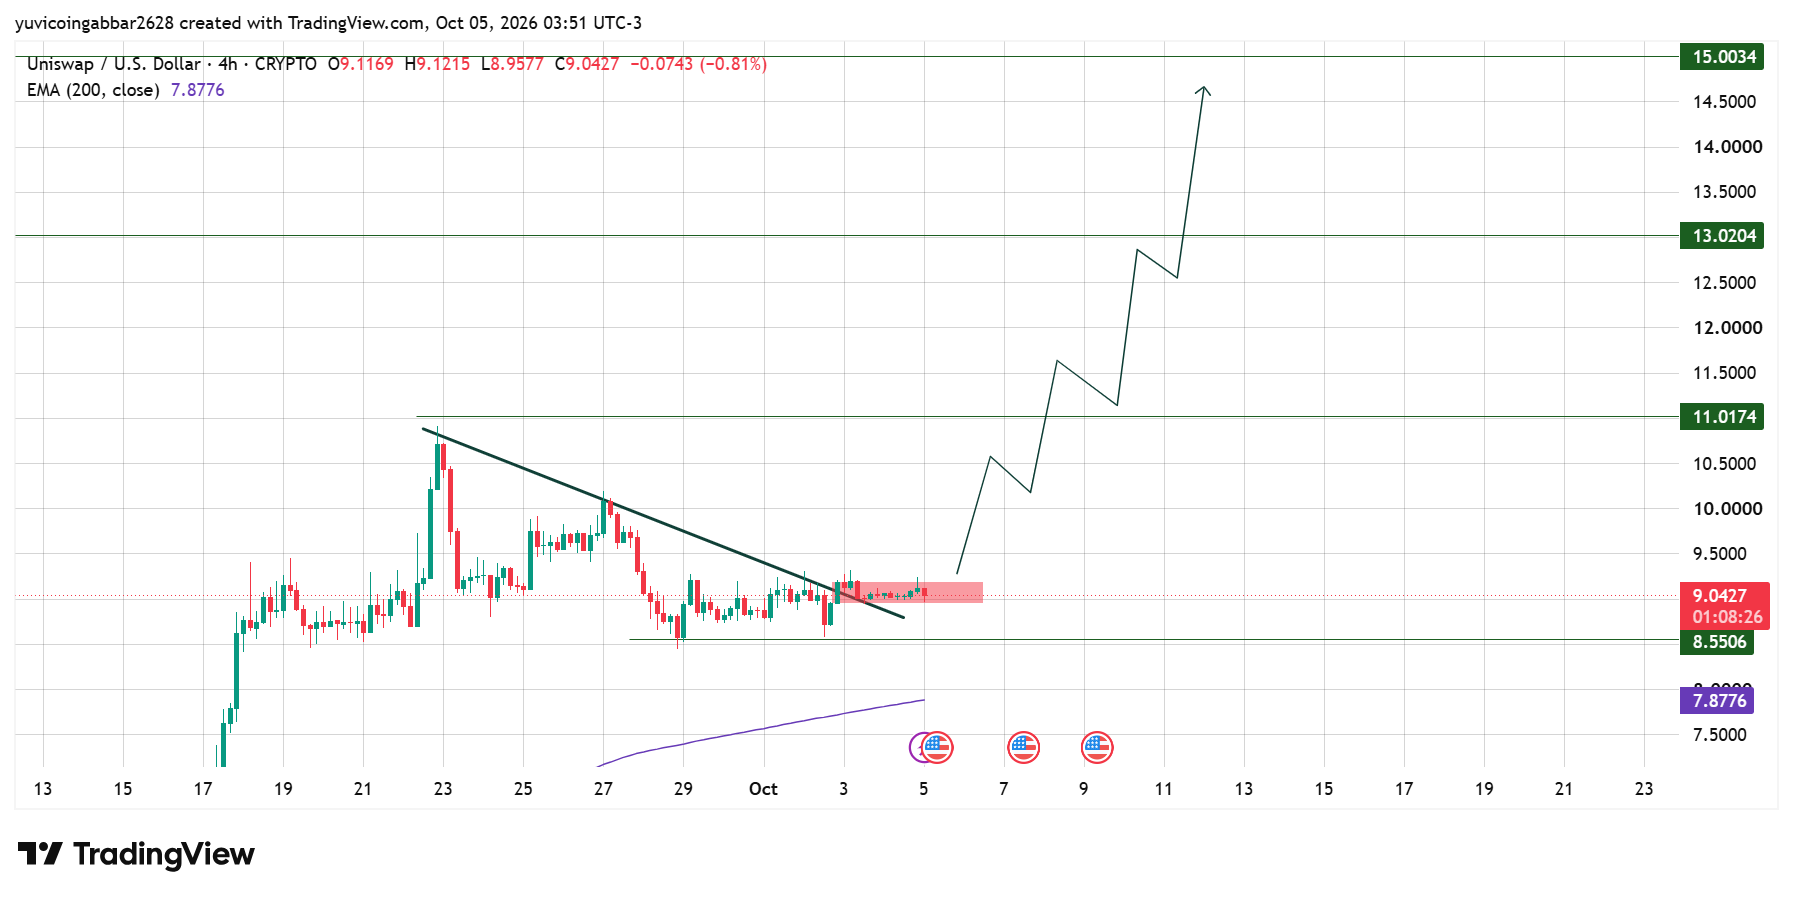
A confirmed break of the consolidation could strengthen bullish momentum, with $11.0174 as the first major upside level, followed by $13.0204 and potentially $15.0034.
On the downside, $8.5506 is the key support, while the 200 EMA at $7.8776 remains an important lower support. A break below $8.5506 could weaken the bullish setup.
Uniswap Forecast: Support and Resistance Levels
Level Type | Price |
Resistance 3 | $15.0034 |
Resistance 2 | $13.0204 |
Resistance 1 | $11.0174 |
Immediate Price Reference | $9.0427 |
First Support | $8.5506 |
Deeper Support (EMA 200) | $7.8776 |
The Uniswap Outlook
Bull case: If UNI posts a 4H close above $9.68, it would meet CW's condition for a bullish shift. The chart then shows $11.0174 as the next test, with $13.0204 beyond it.
Bear case: A 4H close below $8.5506 would put the sideways range in doubt. In that scenario, the 200 EMA near $7.8776 becomes the next reference, about 13% below the current price.
Uniswap price prediction: Can UNI Reach $15?
The $15.0034 line is the highest on the chart and sits about 66% above today's price. UNI would need to pass $9.68, $11.0174, and $13.0204 along the way.
Each of those would need to hold on a 4H close, and the chart's arrow path shows pullbacks between them. It is a long route, not a single step.
Uniswap price prediction 2026: Expert View
According to CoinGabbar analysts, this UNI price prediction rests on one idea: price is sitting just above a broken trendline, and the next few 4H closes show whether that line becomes support.
The 200 EMA is far below, so a drop to $8.5506 would not yet damage the longer trend. Small liquidation totals suggest traders are not heavily positioned either way.
Disclaimer
This piece is for informational purposes only and isn't financial advice. The levels and scenarios above are based on technical chart analysis and publicly available data at the time of writing. Crypto markets can move sharply within hours, so past patterns don't guarantee future outcomes. Do your own research and consider your risk tolerance before acting on any level discussed here.










.webp)






