Bitcoin, Ethereum, XRP Price Prediction: Can FOMC Minutes Lift It?

The crypto market is higher today, and the total market cap has climbed to $2.93 trillion. This Bitcoin, Ethereum, and XRP price prediction looks at what is driving the move and what comes next.
Bitcoin is up 0.90% and trades just above $86,000. Ethereum is holding above $2,700, up about 0.5%. XRP gained 1.22% and sits above the $1.50 support.
Why Are Bitcoin, Ethereum and XRP Prices Up Today?
A weak U.S. jobs report pushed traders to cut their bets on an October Fed rate hike. Last week's PCE inflation data also showed a drop in consumer prices. Bitcoin jumped after that report.
That mix gave crypto some room to rise. Lower rate hike odds usually help risk assets.
What Are the Odds of a Fed Rate Hike in October?
The Fed raised rates by 25 basis points to 3.75% to 4% at its September 16 meeting. Fed Chair Kevin Warsh said inflation was "too high" after that.
Hike odds then jumped. Now they have fallen back. CME FedWatch data for the October 28 meeting shows this:
Outcome (Oct 28 meeting) | Now | 1 Day Ago | 1 Week Ago (Sep 28) | 1 Month Ago (Sep 4) |
No change (3.75% to 4%) | 80.6% | 77.9% | 29.1% | 54.4% |
Hike (4% to 4.25%) | 19.4% | 22.1% | 70.9% | 15.8% |
Cut (3.5% to 3.75%) | 0.0% | 0.0% | 0.0% | 29.8% |
Fed governor Phillip Jefferson also hinted the Fed might hold rates in October. A week ago, a hike looked likely. A month ago, a cut was on the table at 29.8%. The mood has flipped fast.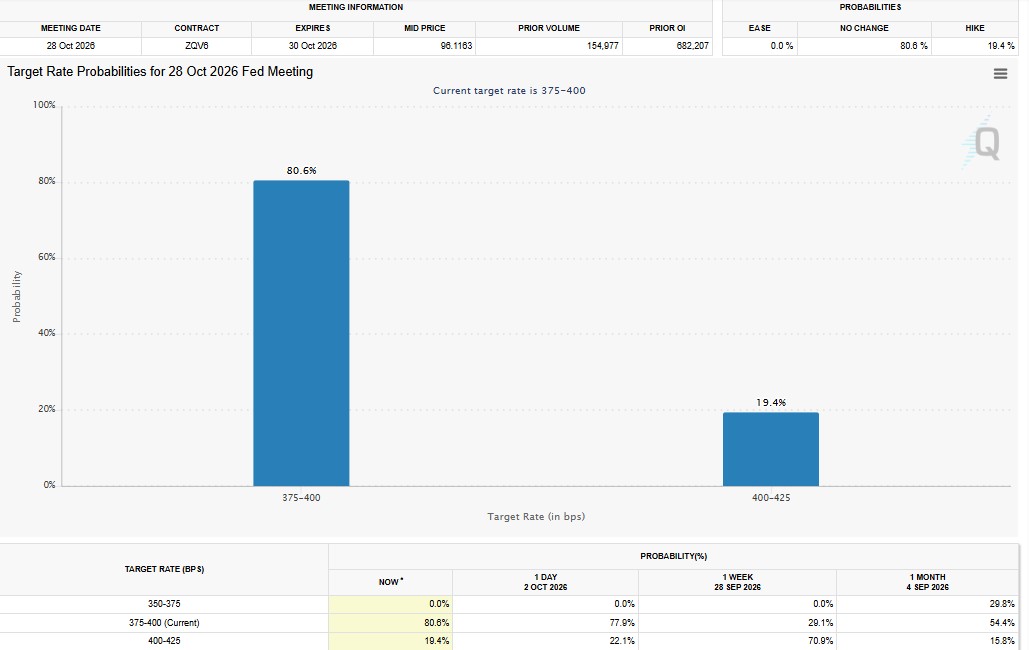
When Are the FOMC Minutes Released, and Will They Move Crypto?
The minutes from the September 15 to 16 meeting come out on Wednesday, October 7. They should show how split the officials were. They may also show how worried the Fed is about inflation and jobs.
Traders will look for a hawkish or dovish tone. Treasury yields, the dollar, and risk appetite can all react.
Day | Event | Why It Matters |
Monday | ISM Services PMI (September) | Services are the largest part of the U.S. economy |
Wednesday | FOMC minutes | Shows Fed views on more hikes |
Thursday | Weekly jobless claims | Last print was 197,000; 4-week average 200,000 |
Friday | Michigan consumer sentiment (October, preliminary) | Not expected to move crypto much |
There is also a wild card. The U.S. and Iran are reportedly bracing for fresh attacks after new developments over the weekend. News from the Middle East could shake markets fast.
Is the Crypto Market in Fear or Greed Right Now?
The Fear & Greed Index reads 70, which is Greed. That means traders are fairly optimistic.
Period | Score | Mood |
Now | 70 | Greed |
Yesterday | 65 | Greed |
Last week | 74 | Greed |
Last month | 73 | Greed |
The score has stayed in the 65 to 74 range for a month. It is high, but not new.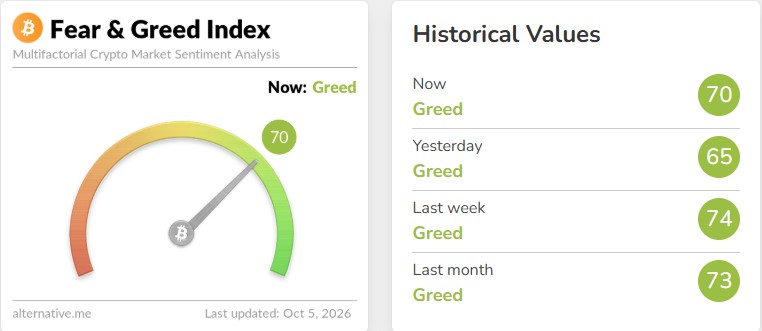
Are Crypto ETFs Seeing Inflows or Outflows?
Bitcoin spot ETFs took in $241.09 million last week, as of October 2. That follows a much bigger $2.39 billion inflow the week before. Total net inflow now stands at $57.79 billion, and net assets are about $108.89 billion.
Ethereum spot ETFs saw outflows of $37.36 million on October 2. Before that, $55.37 million left on October 1 and $59.8 million on September 30. Cumulative net inflow is $13.80 billion.
XRP spot ETFs have posted mostly positive flows for 12 weeks. Total net inflows are near $1.79 billion.
Leverage was also hit. About $172.95 million was liquidated in 24 hours, with $121.47 million from longs. Bitcoin made up $73.09 million of that. The biggest single order was $5.63 million, an ETHUSDT trade on Binance.
Bitcoin Price Prediction: Will BTC Hit $92,000?
Bitcoin fell to $60,000 earlier, and many traders expected $50,000 next. It did not happen. Some analysts now call that low a double bottom.
Their view is simple. If BTC holds $80,000 to $82,000, the first target is $92,000 to $97,000. A longer target sits at $109,000.
For the short term, one analyst says BTC must hold $83,000 and close the week above $85,600 to confirm a bull flag. Bitcoin is also pressing the top of its channel. A break could aim near $95,000.
This is a view, not a promise. A drop below $80,000 would weaken the setup.
Ethereum Price Prediction: Can ETH Reach $3,000?
ETH is taking a breather after the September push, but it has not slipped back into its old range. It just posted its highest weekly candle in over eight months.
The levels to watch:
Level | Meaning |
$2,600 to $2,635 | First support, where buyers need to step in |
$2,480 to $2,520 | Next zone if $2,600 breaks |
$2,780 to $2,800 | Ceiling ETH keeps testing |
$3,000 | Next test after a daily close above the ceiling |
$3,400 to $3,500 | Possible target on a weekly close above $2,800 |
A quick wick above $2,800 is not enough. Analysts want a daily close, then a hold. Spot demand also matters, and ETF outflows are a small worry.
XRP Price Prediction: Will XRP Break $1.53 This Week?
Peter Brandt (The Factor Report, @PeterLBrandt) shared an XRP/USD daily chart on X that points to a possible cup-and-handle pattern. He even posted a coffee mug on the chart as a joke. Resistance sits around $1.50 to $1.55.
A confirmed breakout could aim for about $1.67 in the short term. Brandt has also shown a longer-term chart that points toward $5.40. Both targets are speculative. They need a firm breakout and strong volume.
Analyst Ali sees XRP squeezing inside a triangle, getting close to the tip. A bigger move may be near. A 4-hour close above $1.53 could confirm a bullish break and open the way to $1.62.
Whales have mostly stayed quiet this past week. No big change in their holdings.
Bitcoin, Ethereum, XRP Price Prediction: What to Watch Next
Everything may hinge on Wednesday. Soft Fed words could help all three coins. A hawkish tone could undo this week's gains.
Coin | Price Now | Key Support | Key Resistance |
Bitcoin | Just above $86,000 | $83,000 | $92,000 to $97,000 |
Ethereum | Above $2,700 | $2,600 | $2,800 |
XRP | Above $1.50 | $1.50 | $1.53 to $1.55 |
Markets can turn fast. Watch the data, the Fed, and the headlines from the Middle East.
Disclaimer
This article is for information only and is not financial, investment, or trading advice. Cryptocurrency prices are highly volatile, and you can lose some or all of your money. Price targets mentioned here come from analysts and are not guaranteed. Do your own research and speak to a licensed financial advisor before making any investment decision.








.webp)








