XRP Price Prediction: Peter Brandt Spots Cup and Handle, $5.40 Target?

The XRP price today is near $1.51, up 1.53% on the day. The wider crypto market is also higher. Its total market cap is up 1% and sits above $3 trillion.
Veteran trader Peter Brandt shared a chart that is leading XRP news today. He points to a cup-and-handle shape on the daily chart.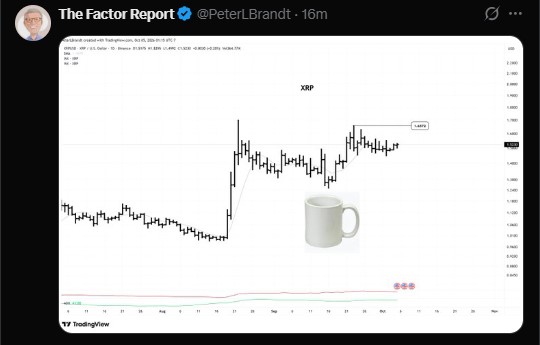
XRP News Today: What Did Peter Brandt Share on X?
Brandt posted the chart on X through his account, The Factor Report (@PeterLBrandt). It shows the daily XRP/USD price on Binance, drawn on TradingView. The price scale runs from about $0.90 to $2.30.
The chart shows a slow climb from a low near $1 in August. Then came a sharp jump in late August. Since then, the price has moved mostly sideways through September.
That flat stretch near the highs is the "handle". A small marker label sits near the top of it, close above $1.50. A smaller panel at the bottom of the chart adds extra lines.
Brandt did not add a long note. The chart did the talking.
Is XRP Forming a Cup and Handle Pattern?
A cup and handle is a common chart setup. Price falls, curves back up, then rests for a while. Traders watch for a move above that resting zone.
Here, the rounded recovery from the earlier drop forms the cup. The sideways trading near the highs forms the handle.
Resistance sits around $1.53 to $1.55. The token is already trading inside that zone, so the test is happening right now.
The pattern is not confirmed yet. A clean break above the handle is needed, ideally with strong trading volume. Volume is simply how much of the coin changes hands, and it shows how many traders back the move.
XRP Price Forecast: What Is the Short-Term Target?
If the breakout holds, the chart points to about $1.67. From $1.51, that is a gain of roughly 10.6%.
That is a small move compared with the big long-term calls. It can also fail. Cup-and-handle setups do not always work out.
A drop back below the handle would weaken the idea. This is why many traders wait for a close above $1.55 before they trust the move.
Peter Brandt Predicts XRP Price: Can It Reach $5.40?
On September 21, Brandt posted a monthly chart of XRP against the US dollar. He said the structure on it implies a move toward $5.40 over the long run.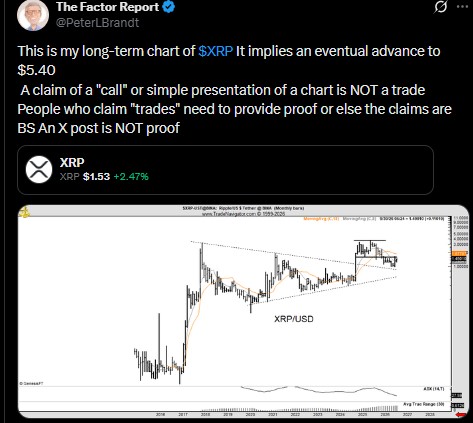
He gave no date for that number. In short, Peter Brandt predicts XRP price could rise far above today's level, but only over a long and open-ended period.
From $1.51, a rise to $5.40 would mean a gain of about 258%. That is a big jump. The original report adds a clear note: a chart is not a trade.
When the chart first drew attention, the XRP price was near $1.53, up about 1.70% on the day. That small gap shows how fast the number moves in a single session.
Key XRP Price Levels to Watch Now
Level | Price | What It Means |
Current price | About $1.51 | Up 1.53% on the day |
Handle resistance | $1.50 to $1.55 | Zone price must clear to confirm the pattern |
Short-term target | About $1.67 | Chart target if the breakout holds |
Long-term target | $5.40 | Brandt's monthly chart view, no date given |
Crypto market cap | Above $3 trillion | Up 1% on the day |
What Happens If the Breakout Fails?
Failed breakouts are common in every market. If price slips under the handle, the cup-and-handle idea loses strength.
The wider market matters too. A $3 trillion crypto market shows a positive mood right now. That mood can change fast.
There is also a gap between the two views. The $1.67 level is close. The $5.40 level is far away, with no time frame attached.
So what should readers watch next? Look for a daily close above $1.55 and a rise in volume. Without both, the setup stays unconfirmed.
Anyone following XRP latest news should treat each chart as one view, not a promise. Until a breakout shows up, the XRP price prediction stays open to both outcomes.
Disclaimer
This article is for information only. It is not financial, investment, or trading advice. Crypto prices are highly volatile, and you can lose some or all of your money. Chart patterns and price targets are opinions, not guarantees. Always do your own research and speak with a licensed financial advisor before you invest.








.webp)








