Bitcoin Price Forecast: Why Is BTC Down Today Below $84K Support?


Bitcoin is trading near $83,990.20 at the time of writing. That is down 2.13%, or about $1,827.93, in 24 hours.
The wider crypto market is red too. Total market cap is down 1.8% and sits near $2.86 trillion.
This price forecast covers the data, the news, and the levels traders are watching.
BTC Price Today: What Do the Numbers Show?
Metric | Value |
BTC price | $83,990.20 |
24h change | -2.13% |
Market cap | $1.69 trillion |
Futures volume (24h) | $58.69 billion |
Spot volume (24h) | $5.17 billion |
Open interest | $55.12 billion |
Long/short ratio (24h) | 0.9164 |
Futures volume is far bigger than spot volume. Leverage is driving most of the action right now.
Why Is BTC Down Today?
Several things hit at once.
Just before the dip, four new wallets sent 1M USDC to Hyperliquid. They opened 40x shorts on 148.49 BTC, worth about $12.5 million.
Lookonchain asked if these wallets were insiders. That is only a question, not proof.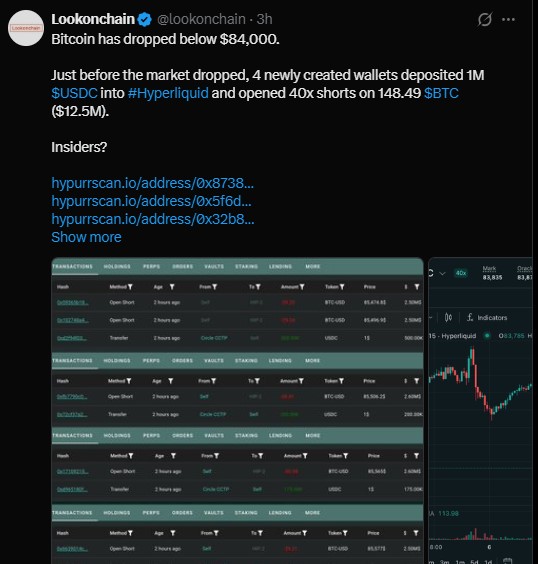
Long traders took the pain. In 24 hours, $142.76 million was liquidated, and $129.25 million of it was longs.
Period | Total Rekt | Long | Short |
1 hour | $265.91K | $262.37K | $3.54K |
4 hours | $924.01K | $276.39K | $647.62K |
12 hours | $122.65M | $119.35M | $3.30M |
24 hours | $142.76M | $129.25M | $13.51M |
Most of the damage came earlier. The last four hours were much quieter.
Big traders still lean long. Binance top traders show 1.4679 by accounts and 1.653 by positions. The overall 24-hour ratio is 0.9164, which leans slightly short.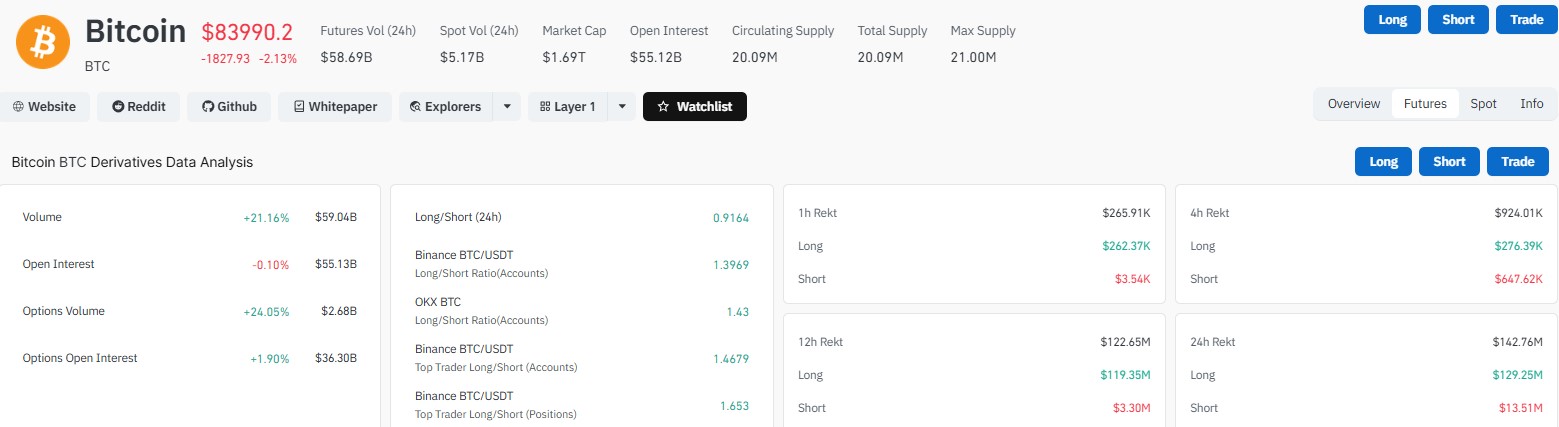
Is the U.S. Government Selling Bitcoin? Latest Bitcoin News Today
Lookonchain, using Arkham data, says the U.S. government moved 834 BTC (71.56 million) and 40,285 BNB (31.63 million) today. The 834 BTC went into Coinbase Prime.
A deposit is not a sale. Still, traders watch these moves closely because they can add supply.
BTC News: Are Coins Leaving Exchanges?
Santiment says 24,073 $BTC left exchanges on net on Monday. That is the biggest daily outflow since March 1.
Exchange supply is now about 6.50% of total Bitcoin. Fewer coins on exchanges can mean less selling pressure. It guarantees nothing.
Are Spot Bitcoin ETFs Still Buying $BTC?
Based on October 6 data, yes. Daily net inflows were $118.86 million, and cumulative net inflows reached $57.82 billion.
BlackRock's IBIT took in $122 million and holds $69.04 billion in net assets. Fidelity's FBTC has $15.55 billion. Grayscale's GBTC lost $10.97 million.
Total ETF net assets are $110.68 billion, about 6.43% of BTC's market cap.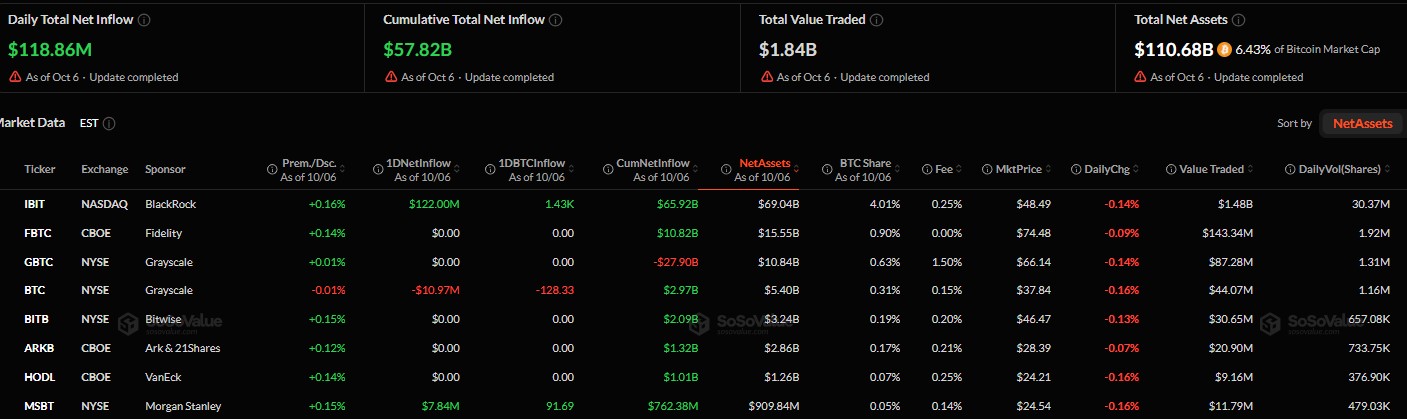
Will the Fed Raise or Cut Rates on October 28?
Traders expect the Federal Reserve to hold rates at 3.75% to 4.00%.
Fed Outcome (Oct 28) | Probability | One Week Ago |
Hold at 3.75%-4.00% | 79.0% | 62.4% |
Hike to 4.00%-4.25% | 21.0% | 37.6% |
Cut to 3.50%-3.75% | 0% | n/a |
Hike odds fell from 37.6% to 21%. But a hike would still weigh on risk assets like crypto.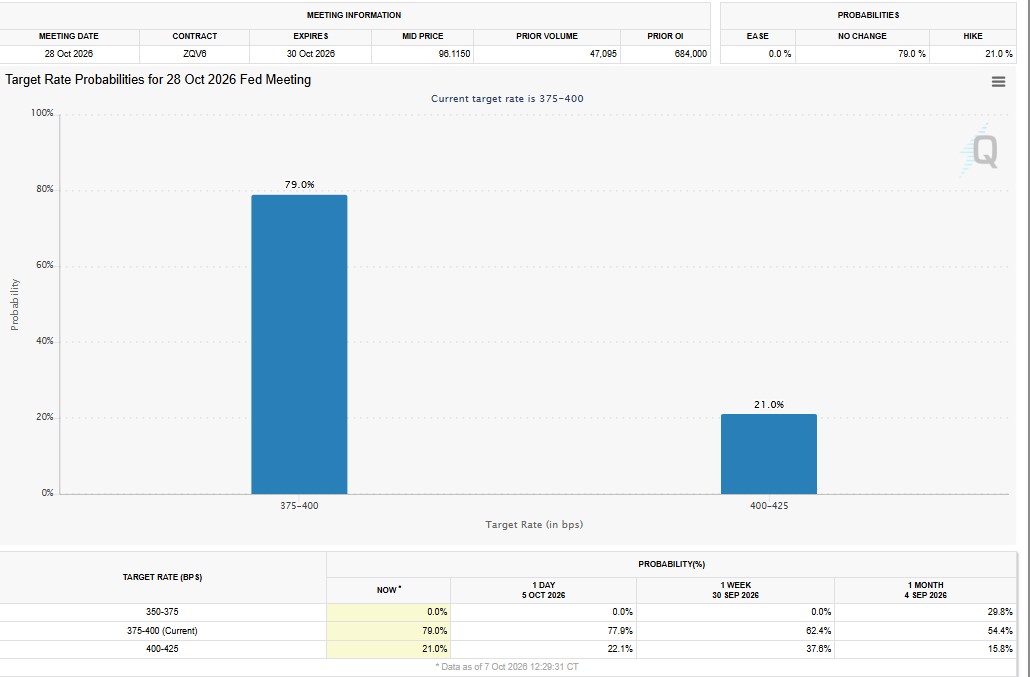
BTC Price Prediction: What Are the Key Levels?
On the 4-hour chart, The asset broke out of an ascending triangle. Then it failed to hold the move. That looks like a possible false breakout.
Sellers have regained control for now.
Level | Zone | What It Means |
Resistance | $86,000 to $87,000 | Triangle breakout zone |
Upside target | $88,000 to $90,000 | Only if buyers reclaim resistance |
First support | $83,000 to $82,500 | Next stop if selling continues |
Deeper support | $80,000 | Possible if pressure grows |
If the asset stays under $86,000 to $87,000, a move toward $83,000 to $82,500 is possible. Then $80,000 if selling grows.
If buyers reclaim that zone and hold on a 4-hour close, the bearish case weakens. Then $88,000 to $90,000 comes back into play.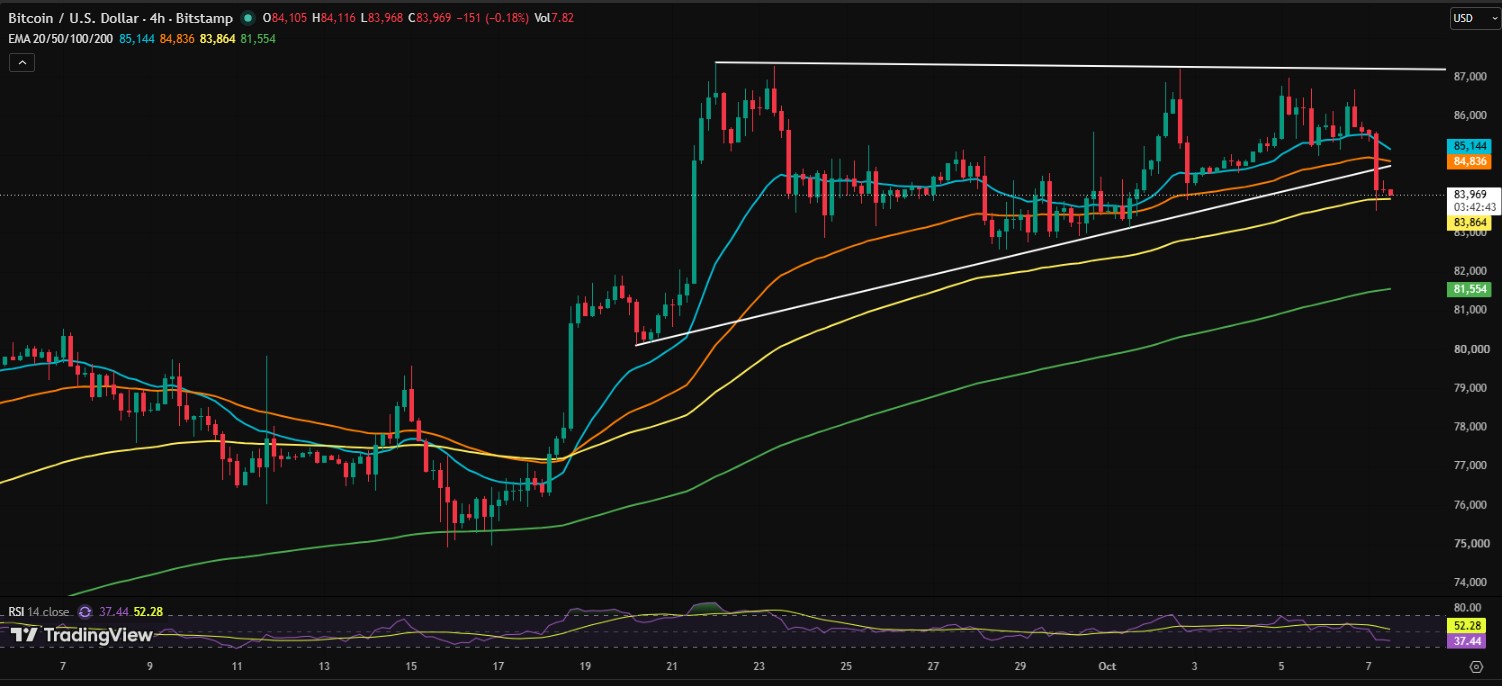
The outlook is bearish to neutral. The key test is whether BTC can get back above the triangle zone. Nothing here is certain.
Disclaimer
This article is for information only. It is not financial advice. Crypto is volatile, and you can lose money. Do your own research and speak to a licensed advisor before investing.












.webp)




