Fusionist Ace Token Unlock: $ACE Price Prediction After 47% Surge


Fusionist Price Prediction: Can the Rally Survive Next Token Unlock
Something odd happened to a small Endurance blockchain token this week. One day $ACE sat quietly near its yearly low. The next day, it was up double digits, shorts were getting wiped out, and traders wanted to know if this was real or another head fake.
Why Did Fusionist ACE Price Jump Today, and Can It Hold?
Fusionist ACE token unlock chatter has been building all week, and that is not a coincidence. $ACE broke a months-long downtrend right as traders started pricing in what comes next for supply. Here's the thing: a breakout during an unlock cycle usually means buyers are front-running good news, or shorts got trapped and had to cover. Both seem to be happening here.
We pulled up the order flow, and the picture got clearer fast, echoing a pattern flagged in an earlier ACE breakout attempt piece before the move was confirmed. Volume did not just tick up; it exploded.
Whales noticed first. That is usually how these moves start.
Is this sustainable or a trap? The market data below answers that directly.
Key Takeaways
-
ACE is trading near $0.2246, up roughly 47% in 24 hours, after breaking a long descending channel on the daily chart.
-
The next Fusionist ACE token unlock lands mid-September 2026, releasing about 2.85 million ACE worth roughly $630,000.
-
Support sits near $0.133 and $0.062; resistance clusters at $0.349, $0.428, and $0.548.
-
24-hour liquidations hit $2.51 million, and short positions took the bigger share.
-
The base case for 30 days points to $0.025-$0.045, contingent on holding the structure above $0.020.
Fusionist ACE Price Today
As of August 19, 2026, around 05:08 UTC, $ACE traded at $0.2246, up 46.97% on the day. The 24-hour range ran from $0.1541 to $0.2499, a wide band for a token this size.
Market cap sits near $24.17 million, with an unlocked market cap of $23.89 million. Turns out, volume tells a bigger story than price alone.
24-hour trading volume hit $274.38 million, up 64.79%. That puts volume against market cap above 1,150%, an extreme reading tied to speculation, not steady accumulation.
The fully diluted valuation stands near $33.01 million against a max supply of 147 million ACE and a circulating supply of 107.61 million. Holder count sits at 13,900, a figure that updates live on the ACE market data page tracked on CoinMarketCap.
The all-time high of $17.95 came in December 2023, and today's price sits 98.77% below that. Its all-time low of $0.06184 was set a month ago, on July 19, 2026, meaning $ACE has climbed 256.82% off the bottom.
Fusionist ACE Technical Analysis
The daily chart shows $ACE breaking out of a descending channel that capped price since roughly February 2026. That structure held for months, so the break matters.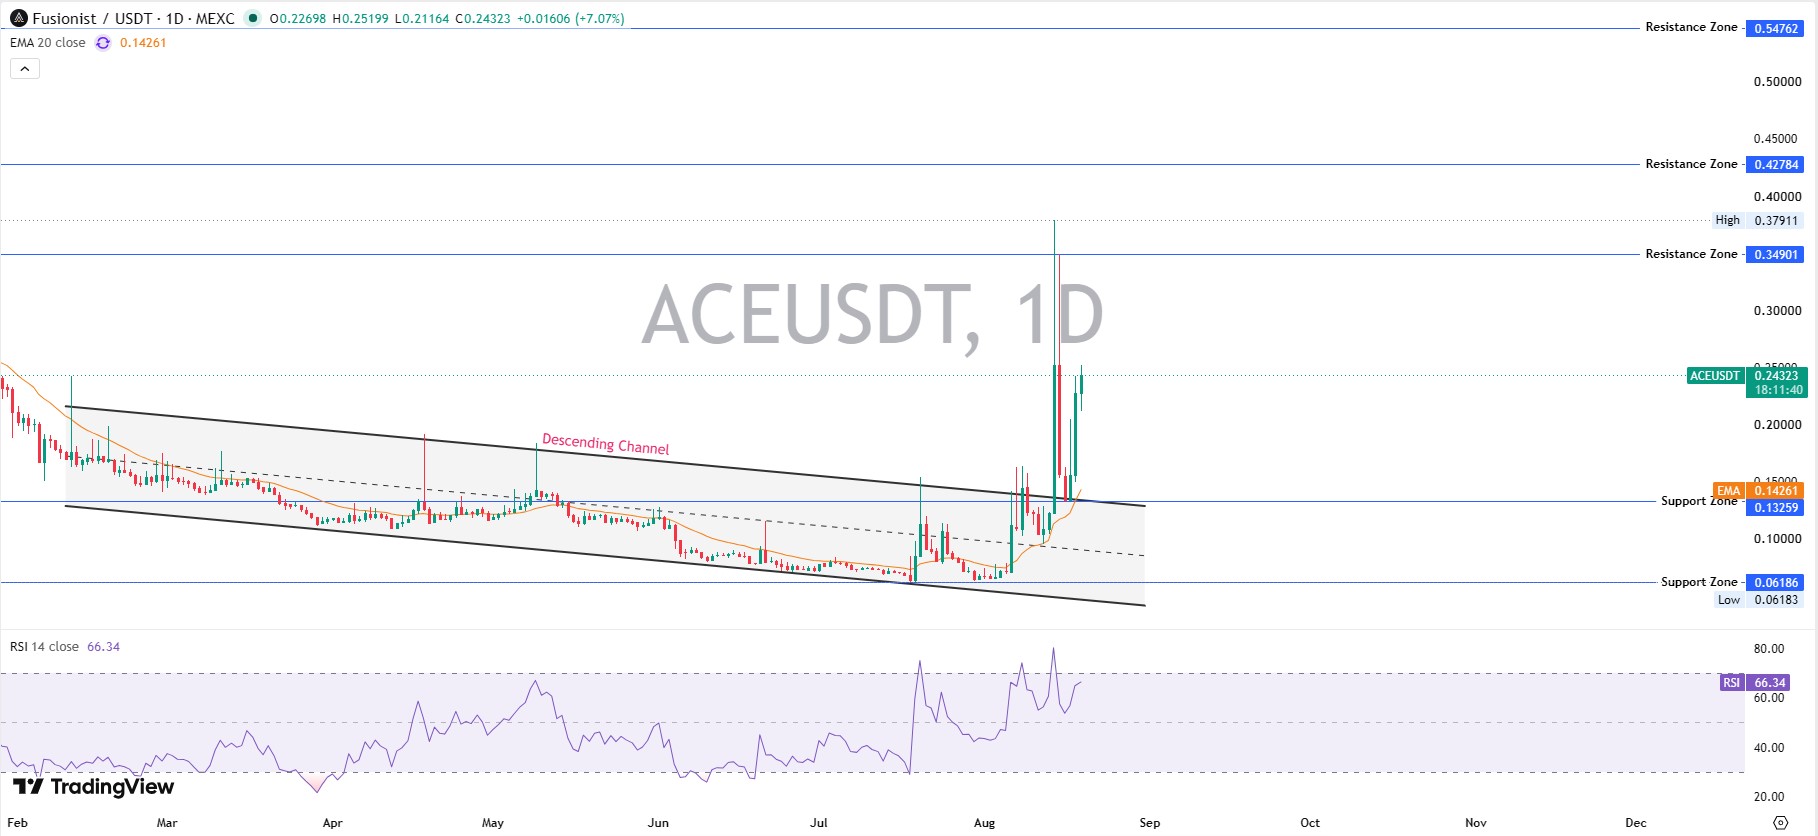
Candles printed an open near $0.227, a high of $0.252, and a low of $0.212, up 7.07% intraday on top of the broader daily gain. The 20-day EMA sits at $0.1426, well below current trading, confirming momentum flipped bullish.
RSI-14 reads 66.34. Elevated, but not yet overbought above 70. Anyone charting this themselves can pull up the same daily chart tool to see the breakout candle against the old channel line.
Resistance zones sit at $0.349, $0.428, and $0.548. Support rests near $0.133, the old channel ceiling now flipped to a floor, with deeper support at $0.062.
But one green candle does not make a trend. Confirmation needs a daily close above $0.20 held for several sessions, similar to the setup covered in the crash-low price action breakdown a few weeks back.
Fusionist ACE Token Unlock Schedule
This is where the Fusionist ACE token unlock story gets specific. As of the CoinMarketCap, 106.36 million ACE, or 72.36% of tracked supply, sit unlocked already. Another 40.62 million ACE, about 27.63%, remains locked.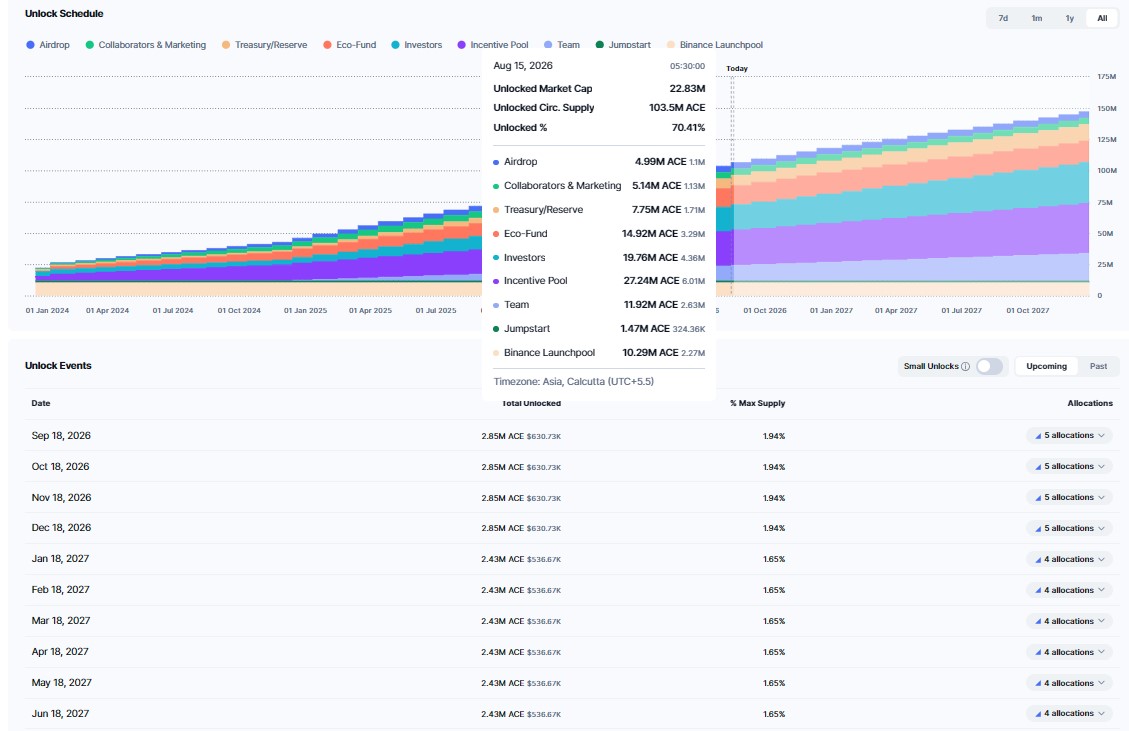
The near-term $ACE token unlock August 2026 schedule shows steady monthly drips, not one giant cliff. September 18, October 18, November 18, and December 18, 2026, each release roughly 2.85 million ACE, worth about $630,000, or 1.94% of max supply. Full dates for this and other tokens sit on the unlock events calendar.
From January 2027 the pace eases slightly, to about 2.43 million ACE, near $536,700, or 1.65% of max supply per month.
Steady monthly unlocks rarely cause a single crash. But they add persistent sell pressure a rally has to absorb every month, the same pattern worth watching on the airdrop and unlock tracker for other tokens heading into supply events.
Tokenomics and Supply
$ACE serves as the native gas and utility asset on the Endurance blockchain, used for network fees, validator staking, and NFT marketplace payments, per the Endurance whitepaper, which lays out the full vesting mechanics behind every unlock date above.
Allocation skews toward incentives and investors. The incentive pool takes the largest slice at 27%, followed by investors at 22.50% and the team at 15%. Eco-Fund holds 11.60% and Treasury and Reserve 9%, with smaller slices for marketing, airdrop, and Jumpstart.
Team allocation carries a 12-month lockup with 36-month vesting and zero tokens at generation, while the Incentive Pool vests over 45 months after an initial 5% release. That long schedule is why monthly unlocks keep showing up on the calendar.
Whale Wallets and Holder Concentration
Concentration runs high here. The top 10 wallets control 84.67% of circulating supply, and the single largest holds 53.93%, worth roughly $5.43 million.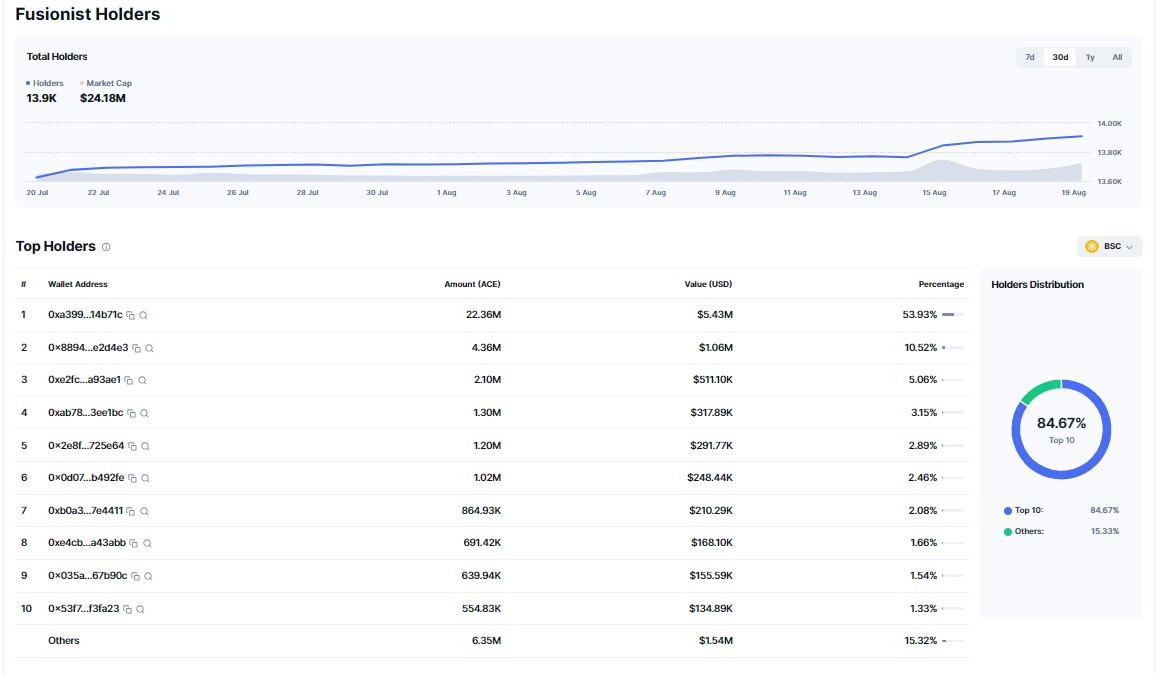
That wallet's size suggests an exchange or liquidity contract, not an individual, though it is not explicitly labeled. A dedicated vesting contract sits further down the rankings, managing about 1.77% of supply on a scheduled release, a structure we broke down further in the earlier Clarity Act delay coverage of ACE.
We would not call this decentralized. That much concentration among ten addresses means a handful of actors can move this market hard, either way.
Fusionist $ACE Price Prediction: Bear, Base and Bull Scenarios
| Timeframe | Bear Case | Base Case | Bull Case | Probability | Invalidation |
|---|---|---|---|---|---|
| 7 Days | $0.14–0.17 | $0.19–0.26 | $0.28–0.35 | Bear 30% / Base 45% / Bull 25% | Daily close below $0.133 |
| 30 Days | $0.09–0.13 | $0.17–0.28 | $0.38–0.55 | Bear 30% / Base 45% / Bull 25% | Weekly close below $0.133 |
| Early 2027 | $0.05–0.08 | $0.20–0.42 | $0.60–0.90 | Bear 25% / Base 45% / Bull 30% | Loss of higher-low structure since August 2026 |
Altcoin Market Context
ACE trades as a mid-cap altcoin, and altcoin behavior right now leans risk-on. Liquidations over the past 24 hours totaled $2.51 million, with shorts absorbing $1.74 million of that against $772,760 in long liquidations, according to the liquidation heatmap data tracked on CoinGlass.
That imbalance matters. When shorts take the bigger hit during a rally, it usually means the move caught bears off guard rather than reflecting patient, planned buying.
That is still a bullish signal short term, just not a guaranteed one.
Yield products add another layer, and the broader appetite for high-APY farming shows up across the wider memecoin market news cycle too, where speculative capital keeps rotating between narratives.
Risks and Invalidation
A volume-to-market-cap ratio above 1,150% flags high volatility risk, not stability. And concentrated whale wallets can exit fast if sentiment turns.
Traders weighing where to manage that exposure can check the exchange listing updates page for where $ACE liquidity is deepest right now.
The clearest invalidation signal across every timeframe is simple: lose the higher-low structure built since August 2026, and the bullish case falls apart.
Conclusion
ACE just did something it had not done in months: it broke structure, on real volume, right as an unlock cycle rolls forward. That is not nothing.
Regulatory headlines have shadowed the wider altcoin market too, and the recent EU MiCA enforcement update gives useful context for anyone trading tokens across European venues.
Macro conditions matter here as well, and the latest Fed policy outlook is worth a look for anyone sizing positions around this unlock window.
Whether fresh demand shows up every few weeks depends on Endurance's ecosystem growth or whether this was shorts panicking into a thin market. Either way, the next few unlock dates will settle the argument.
Disclaimer
This article is for informational purposes only and does not constitute financial, investment, trading, or legal advice. Cryptocurrency markets, including Fusionist ACE, are highly volatile, and prices can move sharply in either direction.
The bear, base, and bull scenarios above reflect analysis of current market structure, not guarantees. Always do independent research and consult a licensed financial advisor before making investment decisions.
Also read:







.webp)








