Radicle Price Prediction: Can Bulls Push Toward $0.5540 Next?


A long falling channel finally broke on October 6, 2026. Radicle (RAD), the token behind the Radworks developer stack, jumped 51.0% in 24 hours to $0.4055.
That move reshapes every Radicle price prediction now, and the RAD price today sits near $0.40. Traders tracking the latest crypto price prediction pages need the key levels first.
But the RSI reads 88.13. That's stretched.
Radicle Price Prediction Market Data Snapshot
Data below reflects October 6, 2026, 10:52 UTC, with CoinGecko market data as the main source.
Metric | Value |
Price | $0.4055 |
24h change | +51.0% |
24h range | $0.2615 to $0.4291 |
Market cap | $23.695M |
Fully diluted valuation | $40.109M |
24h volume | $104.521M |
Circulating supply | 59.076M RAD |
About 59% of max supply circulates. The remaining tokens could add selling pressure later.
Why Is $RAD Moving Today?
Breaking: RAD is up 51.0%. The descending channel is gone. That's the technical trigger behind this RAD breakout.
A fresh listing isn't confirmed either, though recent exchange listings deserve a check.
Radicle Trading Volume and Market Cap
A 51.0% jump sounds like the story. Actually, scratch that, the volume is the real story.
Volume reached $104.521M against a $23.695M market cap. That's roughly 4.4 times the market cap changing hands in one day.
The Uniswap pool handled just $2.08M, with 781 buys against 644 sells. So most trades likely happened on exchanges.
Net buying on the pool hit $244.80K. Traders who follow crypto airdrop updates often spot spikes like this first.
Crypto Market Mood Around RAD
Broader mood isn't euphoric. The Fear and Greed reading sits at 40, which means fear.
Total crypto market cap is $2.988T, down 0.6%, and Bitcoin dominance is 57.8%.
And RAD is moving against that tape. Memecoin news updates can help gauge risk appetite.
Radicle Technical Analysis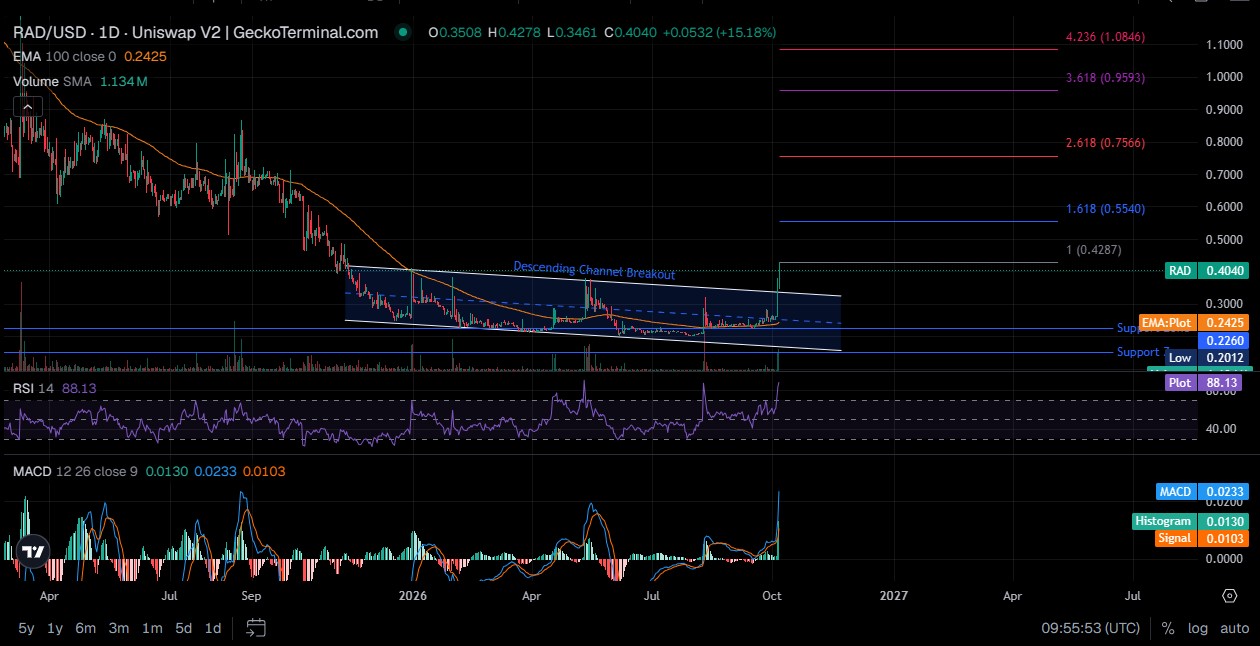
Daily chart data comes from the GeckoTerminal RAD chart. This $RAD technical analysis covers three indicators.
RAD's RSI sits at 88.13. Strong momentum, yes. But also a higher correction risk.
EMA, or exponential moving average, weights recent trades more. The 100-day EMA sits at $0.2425. Price trades far above it. Is one giant candle enough to flip a six-month downtrend? Months of lower highs say otherwise.
MACD compares two moving averages to measure momentum. The MACD line reads 0.0233 against a signal line of 0.0103. Histogram readings add 0.0130, and positive, widening bars favor bulls.
Radicle Support Levels
Support is a price zone where buyers have stepped in before. First comes the 100-day EMA at $0.2425. Next sits $0.2260. Then $0.2012, almost matching the all-time low of $0.2009. A loss of $0.2425 would erase most of the breakout.
Radicle Resistance Levels
Resistance is where sellers tend to show up, so $RAD support and resistance levels work as a pair. First hurdle: the $0.4291 24h high, right beside the $0.4287 Fibonacci level.
Fibonacci extensions mark possible targets based on a prior swing. And the next RAD price target zones are $0.5540, $0.7566, $0.9593, and $1.0846. Each one is a hurdle. Not a promise.
Radicle Holder Concentration
Etherscan holder data shows a heavy top. The top 10 wallets hold 76.89%, and the top 100 hold 98.12%.
Radicle: Timelock alone holds 40.92%. A timelock is a contract that locks tokens until set dates, so it isn't necessarily a seller.
But the Gini score of 0.996 signals extreme concentration, since 1.0 is the maximum.
Radicle Price Prediction for October 2026
Each $RAD price prediction path depends on volume and key levels.
Bull Case
If RAD trades above $0.4291 with rising volume over the next few weeks, a test of $0.5540 could follow.
This RAD price prediction scenario breaks if price slides under the $0.2425 EMA.
Base Case
Cooling is the more likely path after an RSI of 88.13. Price could drift toward the old channel top, roughly $0.33, before another push.
Sideways trading under $0.4291 keeps this case alive. A clean push through $0.5540 would end it.
Bear Case
If sellers take over, a loss of $0.2425 could open $0.2260, then $0.2012. That would mean the breakout was a spike, nothing more. Reclaiming $0.4291 with volume would cancel this scenario.
What Could Change the Outlook
Any $RAD price forecast shifts fast when news lands. A new listing, a product update, a governance vote. But none is confirmed today. The coin events calendar is the place to check for dates.
Radicle Long-Term Price Outlook
The all-time high is $27.61, and RAD still trades 98.5% below it.
Radworks says it's building a sovereign developer stack on Ethereum. Infrastructure tokens sometimes ride wider themes, including those in AI crypto news.
A hold above $0.5540 would be the first real long-term strength sign. Until then, a year-end run toward $0.7566 is only a possibility.
Risks That Could Change the Radicle Price Prediction
Concentration comes first. A few wallets can move a $23.695M market cap.
Liquidity is thin too. The pool holds $2.6M, so big orders slip.
Thin pool liquidity, heavy concentration, and an overbought RSI. Together, that's a fragile setup.
Newer launches in crypto presale listings also compete for the same attention.
Final Takeaway
Bias stays cautious in the near term. The breakout is real, but an RSI of 88.13 invites a pullback. Bulls need $0.4291 held with volume. Bears need a slide under $0.2425. Timing matters here.
Disclaimer: This article is for information only and isn't financial advice. Crypto prices are volatile and can fall fast. Independent research is needed before any trade. Data reflects October 6, 2026, 10:52 UTC.











.webp)





