Quant Price Prediction: Will QNT Break $262 After Its 400% Rally?

Quant is trading near $254.15, down 0.64% in the past 24 hours. The token is cooling after a rally of about 400%, while the wider crypto market slipped a little.
QNT now sits inside a tight triangle on the daily chart. Neither bulls nor bears have taken control yet.
This Quant price prediction looks at the data, the key levels, and what analysts are watching.
What Is the QNT Price Today?
Quant is priced at $254.15. Here is the current snapshot from the derivatives dashboard.
Metric | Value |
Price | $254.15 |
24h change | -0.64% |
Market cap | $3.07B |
Futures volume (24h) | $1.13B |
Spot volume (24h) | $121.38M |
Open interest | about $179M |
Circulating supply | 12.07M QNT |
Total and max supply | 14.88M QNT |
As per CoinGlass Derivative Data, futures volume is far bigger than spot volume. That means derivatives traders have a lot of say in short-term moves.
Futures volume also fell 8.50% in the last day. Open interest dropped 4.18%.
About 81% of the max supply is already in circulation.
Why Is Quant Going Up This Month?
QNT has had a strong month. News around the ECB's expanded digital euro testing likely helped.
Its link to The Clearing House On-Chain Money Initiative also likely brought the institutional story back.
The dip this week stopped near $254. That is a zone traders flagged earlier as support.
Dip buying and some short covering may have played a part. That is a guess, not a confirmed cause.
Are QNT Traders Betting Long or Short?
The overall 24-hour long/short ratio is 0.9608. A reading below 1 means slightly more short than long positions.
Other exchanges and top traders lean the other way.
Long/short ratio | Reading |
24h overall | 0.9608 |
Binance QNT/USDT (accounts) | 1.2691 |
OKX QNT (accounts) | 2.34 |
Binance top traders (accounts) | 1.2411 |
Binance top traders (positions) | 1.5259 |
Larger traders on Binance hold more long positions than shorts. Still, the mixed picture shows the market is split.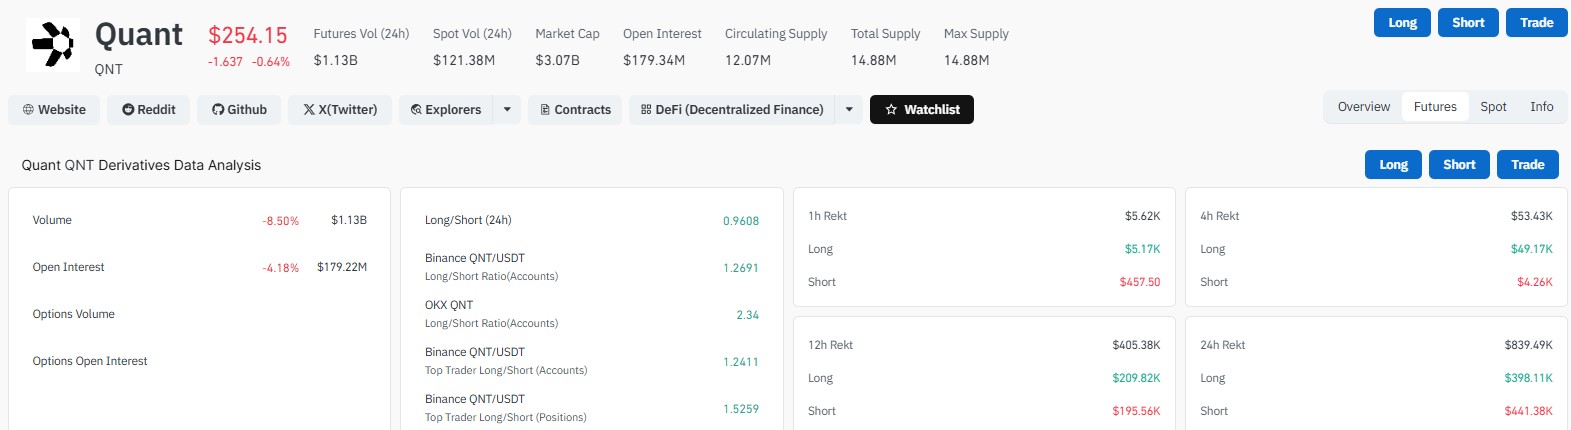
How Much QNT Was Liquidated in 24 Hours?
Liquidations were small for a $3 billion asset.
Period | Total | Longs | Shorts |
1 hour | $5.62K | $5.17K | $457.50 |
4 hours | $53.43K | $49.17K | $4.26K |
12 hours | $405.38K | $209.82K | $195.56K |
24 hours | $839.49K | $398.11K | $441.38K |
Shorts lost slightly more over 24 hours. Over the last four hours, though, longs took most of the hit.
What Are the QNT Support and Resistance Levels?
Two analysts shared charts this week. Both see a symmetrical triangle that keeps getting tighter.
Ali Charts says an hourly close above $262 would confirm the breakout he is watching. His chart also marks $275.61 and $291.80 along the way.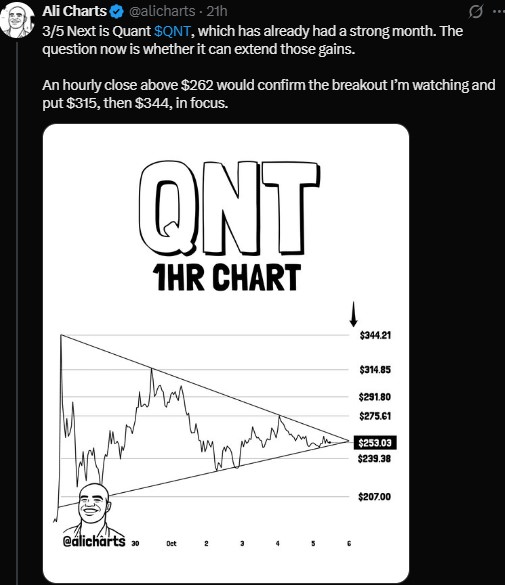
Egrag Crypto says nothing has changed on the daily chart. There is no confirmed breakout and no confirmed breakdown.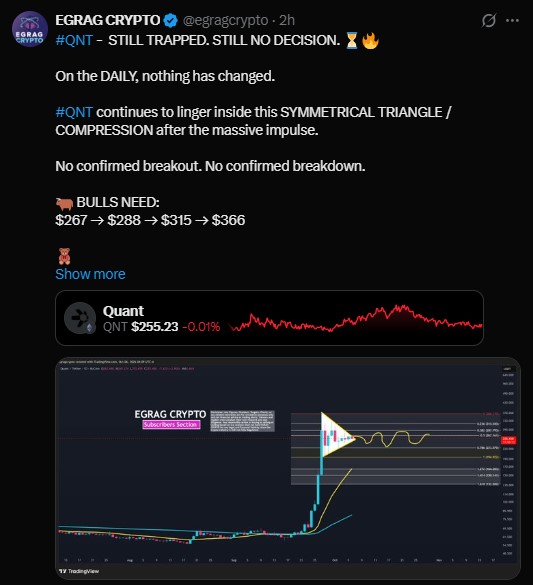
Scenario | Levels to watch |
Ali Charts (bullish) | Hourly close above $262, then $315 and $344 |
Egrag Crypto (bulls need) | $267, $288, $315, $366 |
Egrag Crypto (bears need) | Lose $223, then $195 |
Egrag Crypto (deeper drop) | Below $195, then $164, $150, $132 |
Ali Charts chart support | $239.38 and $207.00 |
The $315 level shows up in both views. That makes it one to watch if price breaks higher.
Will QNT Go Up or Down? Bull and Bear Targets
Nobody knows yet. The triangle is close to its tip, so a bigger move could come soon.
If buyers push above $262 to $267 and hold, the next steps are $288 and $315. A fast spike could also fade, so confirmation matters.
If sellers push price under $223, the chart turns weaker. A loss of $195 would open the path toward $164.
Until then, Egrag Crypto expects chop, fakeouts, and liquidity hunts. Moves inside a triangle often trick traders on both sides.
Volume is falling, and the long/short data is mixed. Quiet markets like this can break out in either direction.
Disclaimer
This article is for information only. It is not financial, investment, or trading advice. Crypto prices are very volatile, and you can lose all the money you put in. Price levels mentioned come from analysts and are not guarantees. Do your own research and speak with a licensed financial advisor before making any decision.











.webp)





