Aligned Price Prediction: Why Did ALIGN Crash 44% After Listings?

Seven top exchanges said yes within a single day, and the market said something very different right back. Airdrop wallets rushed for the exit the moment fresh liquidity showed up, and the token paid for it fast. So what is really driving the drop? Where could price go from here? And does any of this actually break the long-term thesis behind our Aligned price prediction? Here is the full breakdown.
Key Takeaways
ALIGN launched across seven major exchanges within roughly 24 hours, yet the token fell as much as 44% from its all-time high.
The core catalyst is airdrop supply hitting the market the moment trading opened, not a fundamental problem with the project.
Only about 16% of total supply is circulating right now, and 98% of that sits with the top ten wallets.
Price is trading below its short-term average with the RSI cooling toward neutral, not oversold.
Our Aligned price prediction leans cautious-to-neutral over the next 30 days, with a base case near current levels and real downside risk if support breaks.
It Landed on Seven Exchanges in One Day
Getting listed on Coinbase and Kraken in the same week would normally set off a party. Instead, holders are watching red candles stack up, and that gap between hype and price is the whole story here.
New tokens do this more often than people admit. Big listings pull in attention, attention pulls in an airdrop crowd, and that crowd often just wants an exit.
So is this a broken project or a liquidity event playing out in real time?
Keep that question in mind, because the answer changes what you do next.
Why Is Aligned Price Falling Today Despite Multiple Listings?
Aligned price prediction conversations right now start with one blunt fact: ALIGN is down sharply since its token generation event, even while Coinbase, Kraken, MEXC, Bitget, Gate, KuCoin, and Bitvavo all added support within about a day of each other.
That is not a coincidence. It's cause and effect.
Every one of those listings opened a fresh withdrawal path for airdrop claimants. And a lot of them claimed just to sell.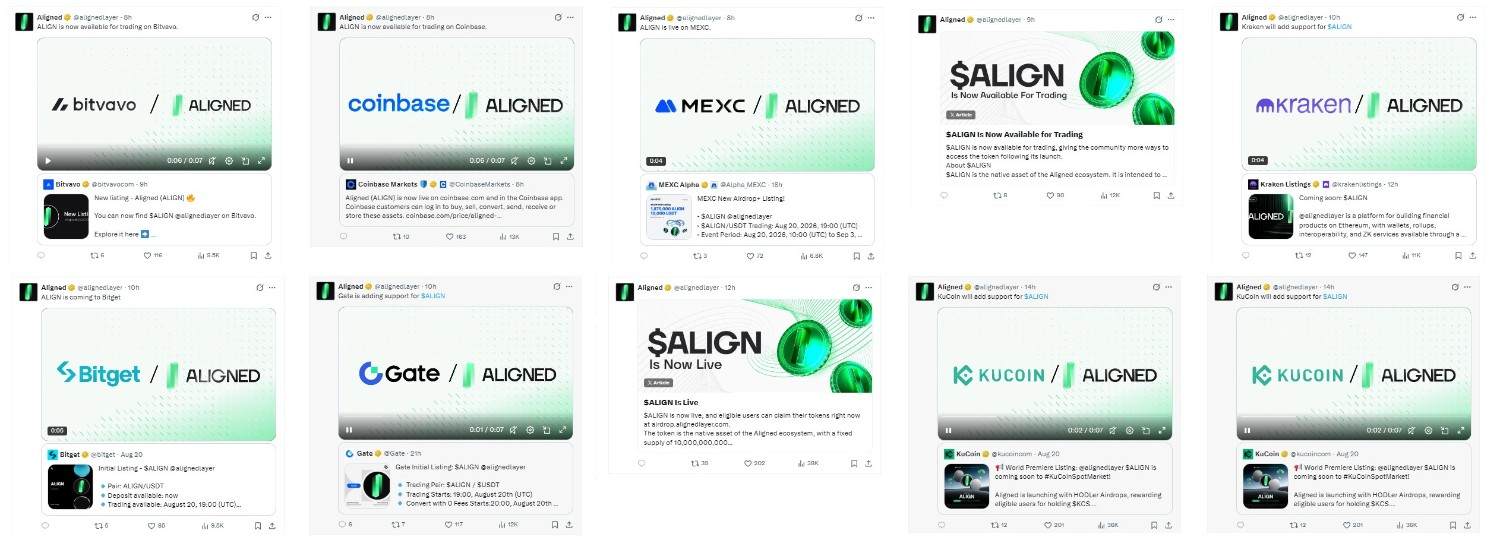
We pulled the official listing announcement and the pattern was obvious: each new venue added a new sell path, not new demand.
Turns out, multi-exchange debuts often front-load supply faster than they front-load buyers. Traders position ahead of the listing, the listing hits, and then the same wallets rotate out once liquidity is deep enough to exit without much slippage.
This isn't unique to Aligned. It's how most freshly listed, low-float tokens behave, and this recent exchange listing news roundup shows the same pattern playing out elsewhere too.
Aligned Price Today: Market Snapshot
As of August 21, 2026, roughly 14:00 UTC, ALIGN was trading near $0.0214, down close to 37% over 24 hours, based on live data pulled during this analysis.
Market cap sits around $35 million against a fully diluted valuation near $214.6 million, per live ALIGN market data. That gap matters, and we'll come back to it.
The all-time high was $0.03381, hit on August 20, 2026. The all-time low, $0.01151, was set the same day.
24-hour trading volume is holding above $11 million, which tells us liquidity hasn't dried up. People are still trading this actively, just not in ALIGN's favor yet, and this broader price prediction coverage tracks similar setups across other tokens.
Chart Analysis: What the Aligned Daily Structure Is Saying
On the 15-minute chart, tracked through this interactive chart tool, ALIGN trades beneath its short-term EMA near $0.0201, a sign momentum has cooled from the initial listing spike.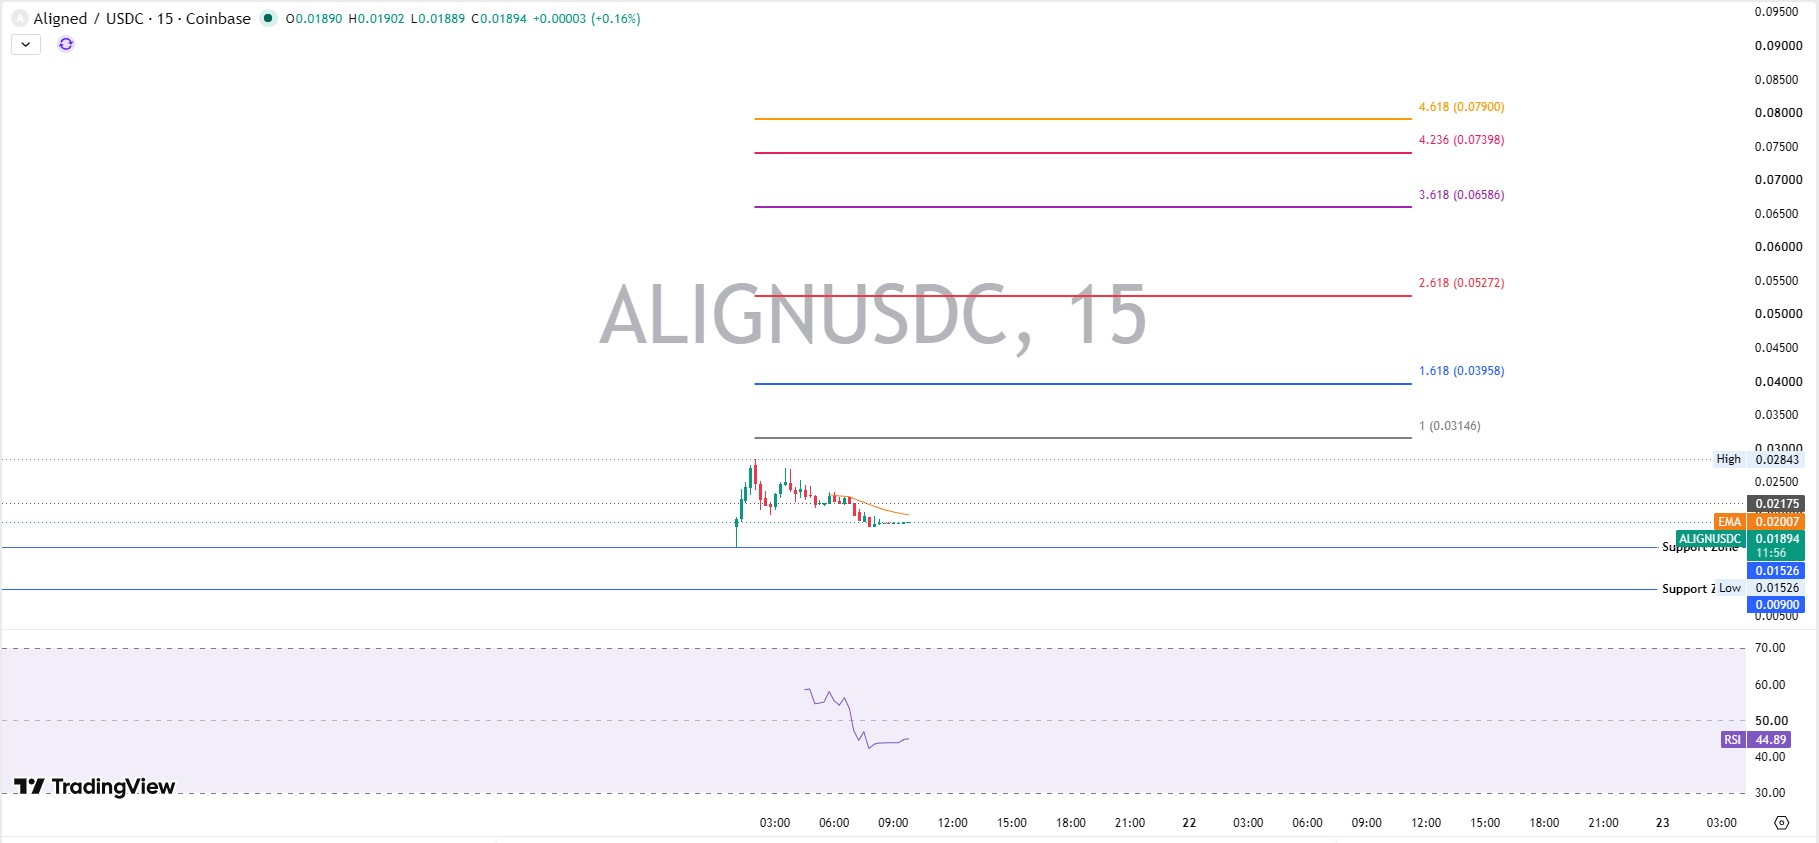
The RSI has slid from the low-60s to roughly 44.89, neutral territory, not oversold. There's room to fall further before any credible Aligned breakout attempt gains traction.
Price built a small base near $0.0189 to $0.0190, then rolled into a lower-high pattern, a short-term bearish structure, plain and clear.
Reading Aligned support and resistance matters more here than any single indicator. The nearest support zone sits around $0.01526, with a deeper floor near $0.00900 if trading breaks down further.
The chart also carries a Fibonacci extension grid drawn off the initial impulse move, with the 1.0 extension near $0.03146, the 1.618 extension near $0.03958, and the 2.618 extension stretching to $0.05272, plus higher marks near $0.06586, $0.07398, and $0.07900.
Price sits well below even the 1.0 level right now, so those marks work as longer-range upside targets, not near-term resistance, a pattern also visible across latest Bitcoin market news whenever majors cool off after a spike. A reclaim of $0.03146 would be the first real signal that buyers are back in control.
Volume has stayed elevated through the decline, which usually means real selling, not thin, low-conviction drifting.
Tokenomics and Whale Concentration: The Altcoin Risk Nobody Skips
Aligned isn't a memecoin. It's infrastructure, built as a zero-knowledge proof verification layer on Ethereum, running through EigenLayer's AVS framework to cut proof verification costs by roughly 90%. That's a real, technical value proposition.
But the token distribution tells a rougher story.
Only about 1.6 billion of the 10 billion max supply are circulating, near 16%. The remaining 84% is currently outside the circulating supply and may enter the market through future unlocks, distributions, or other token-release mechanisms, a setup worth watching alongside this upcoming crypto airdrops list for similar low-float launches.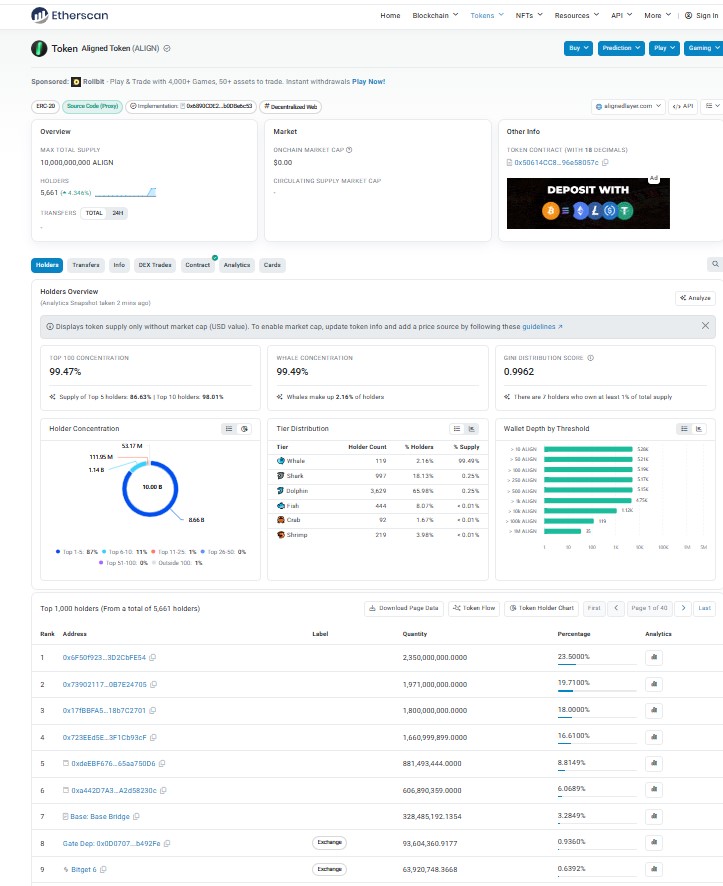
This on-chain holder breakdown shows the top ten holders control close to 98% of circulating supply, and wallets classified as whales make up over 99% of concentration by that measure. The Gini score sits near 0.996, about as concentrated as a distribution gets.
None of that means the project is a scam. It means price can swing hard on a handful of wallet decisions, and that's the honest tradeoff of a low-float altcoin fresh off launch, the kind of structural risk this EU MiCA regulation update touches on from a policy angle.
Liquidity and the Exchange Listing Effect
Seven listings in roughly a day is genuinely rare, and it usually signals a project with real backing, not a fly-by-night launch.
But rare doesn't mean risk-free.
Each new trading pair adds fresh liquidity, and fresh liquidity is exactly what large holders wait for before trimming positions. Bitget, Gate, and KuCoin all confirmed same-day trading, and this exchange listing calendar shows just how packed that window was.
That's the listing wave working as intended for sellers more than buyers, at least for now.
Volume-to-market-cap ratio here is unusually high for a token this young, north of 30%, which points to active two-way trading rather than a dead order book, something worth tracking through this daily crypto news feed as the listings settle in.
Aligned Price Prediction: Bear, Base, and Bull Scenarios
Timeframe | Bear Case | Base Case | Bull Case | Probability | Invalidation |
7 Days | $0.0135 | $0.0195 | $0.0250 | Bear 30% / Base 45% / Bull 25% | Break below $0.0152 support |
30 Days | $0.0110 | $0.0230 | $0.0310 | Bear 30% / Base 40% / Bull 30% | Sustained trading under $0.0100 |
Early 2027 | $0.0090 | $0.0350 | $0.0620 | Bear 25% / Base 40% / Bull 35% | Loss of exchange liquidity or unlock-driven dump |
Key Risks to Watch
Token unlocks are the big one. With 84% of supply still off-market, every future unlock is a potential repeat of this week's selling, and this Federal Reserve policy news shows how rate expectations can pile on top of that pressure.
Whale concentration near 99% means a few wallets can move this market more than any news headline can.
Leverage on newly listed pairs tends to run hot, and that can exaggerate both the drops and the bounces.
And broader market sentiment still matters. A weak week for majors like Bitcoin or Ethereum tends to hit low-cap altcoins like ALIGN even harder, something this Clarity Act crypto bill update ties back to at the policy level.
Wider US regulatory shifts are worth a glance too, and this crypto policy vote coverage rounds out that side of the picture for anyone following ALIGN alongside the macro backdrop.
Disclaimer
This article is for informational purposes only and does not constitute financial, investment, or trading advice. Cryptocurrency markets, especially newly listed and low-float tokens like ALIGN, are highly volatile and can result in significant or total loss of capital. Prices, probabilities, and scenarios referenced above are estimates based on data available at the time of writing and can change quickly. Always do your own research and consult a licensed financial advisor before making investment decisions.










.webp)






