$SHIB Bulls Eye a 50% Surge Today: Shiba Inu Price Prediction

Shiba Inu launched back in August 2020 as an Ethereum-based meme token, created by an anonymous figure who goes by Ryoshi.
It billed itself early on as a self-proclaimed "Dogecoin killer" and eventually grew into one of the largest meme coins by market cap, built around a large burn-focused community and its own layer 2 network, Shibarium.
$SHIB is trading around $0.00000498, up 5.1% over the past 24 hours.
Live Market Data
Here's the live snapshot backing this shiba inu price prediction as of writing.
Metric | Value |
Price | $0.00000498 |
24h Change | +5.1% |
$2.931B | |
Fully Diluted Valuation | $4.974B |
24h Trading Volume | $126.916M |
Circulating Supply | 589.239T |
Total Supply | 589.496T |
Source: $SHIB market cap data taken from Coingecko, data as of Aug 21, 2026. Figures may vary slightly across other tracking websites.
Liquidation Snapshot
Shiba Inu's derivatives market has stayed active through this move.
Over the past 24 hours, $68.64K worth of positions got liquidated, split between $30.99K in longs and $37.65K in shorts, so shorts absorbed the bigger hit as price pushed upward. 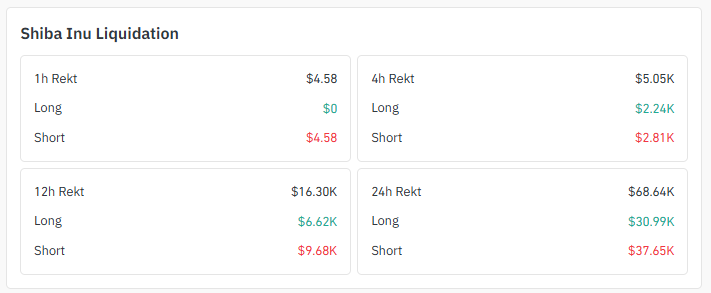
Source: Liquidation Data Taken From Coinglass.
Narrow it to the past hour, and the entire $4.58K wiped out came from shorts, hinting momentum sat with the bulls into this latest candle.
The 4-hour window shows a similar tilt, with $2.81K in short liquidations against $2.24K on longs.
Exchange Volume
Exchange | 24h Volume |
OKX | $29.14M |
LBank | $22.39M |
MEXC | $17.25M |
Bitget | $8.60M |
Gate | $4.57M |
Bitunix | $4.41M |
KuCoin | $2.68M |
Source: Volume Heatmap Data Taken From Coinglass.
Shiba Inu News Today
Social sentiment today is leaning toward a broader memecoin revival. Shiba Inu is getting named alongside
Dogecoin and Pepe as part of a fresh wave of buying interest sweeping the sector, with commentators pointing out that all three "OG" meme names are active again after yesterday's rally. 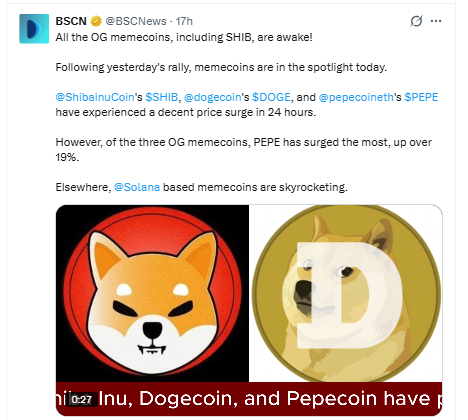
Source: Data Taken From @BSCNews, X Account.
Of the three, Pepe reportedly posted the steepest short-term gain, surging past 19% in a single day, while Solana-based meme tokens have also been catching a strong bid separately.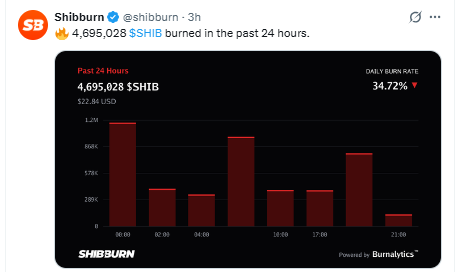
Source: Data Taken From @shibburn, X Account.
Why it matters for SHIB: sector-wide rotations like this rarely happen in isolation. When capital rotates into meme coins as a group, $SHIB tends to catch a tailwind even without news specific to it.
Key Takeaways
SHIB just snapped a falling trendline on the daily chart with real volume behind it, and honestly the Shiba Inu price prediction picture is looking a lot better than it did a week ago.
Price reclaimed the old 0.00000532 resistance shelf as support before this latest push.
A Wolfe Wave structure on the daily timeframe is pointing toward 0.00000600 as the next big level.
Nearly 4.7 million SHIB got burned in the past 24 hours. Deflation never really sleeps with this token.
Get rejected at the first resistance, and the price could slide right back to the 0.00000436 shelf.
24-hour liquidations hit $68.64K, and shorts actually took the bigger hit here at $37.65K.
Technical Analysis: Shiba Inu Daily Chart Analysis
Rewind a bit and you will notice $SHIB carved out a demand zone between 0.00000405 and 0.00000436 in July.
Once buyers stepped in there, the price broke out hard and ran close to 30% before topping out and getting rejected.
From that swing high, sellers took over and dragged the price all the way back down toward the same zone that used to be resistance, only this time it held as support and buyers showed up again.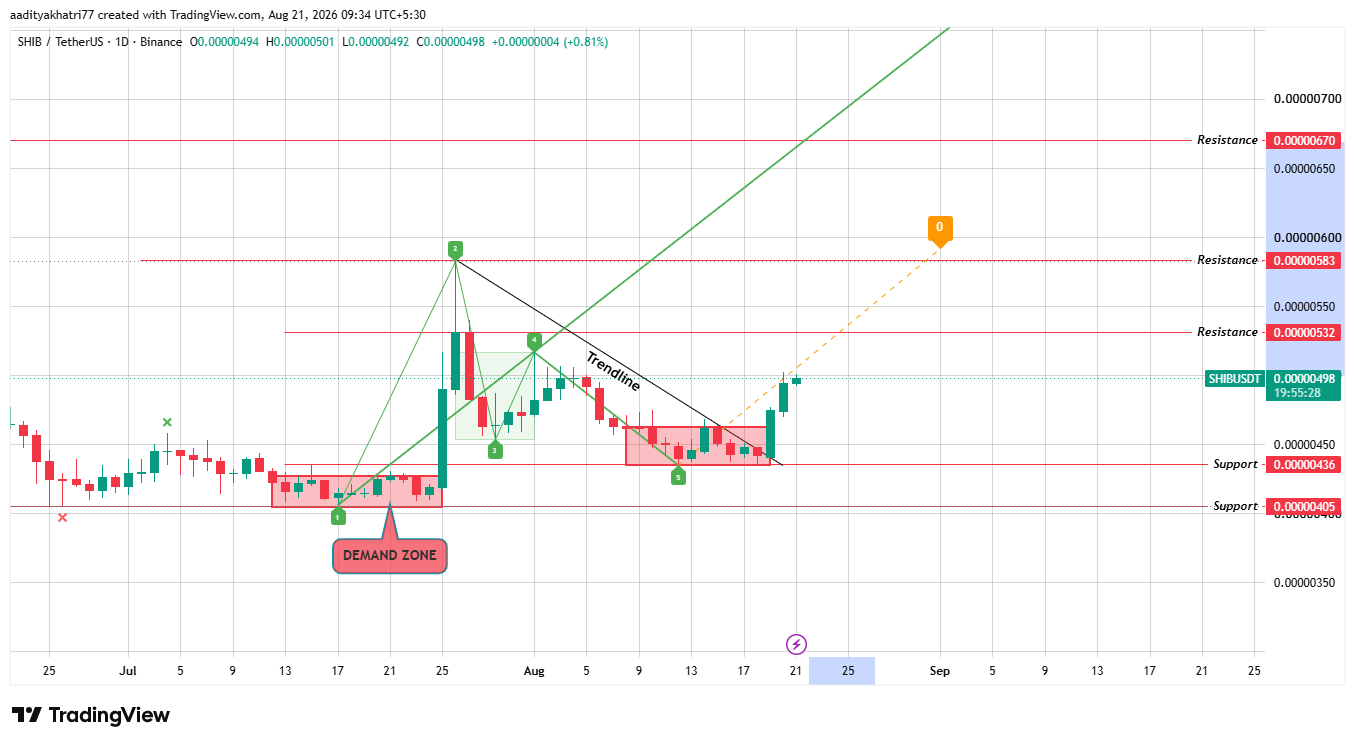
Source: Chart Taken From TradingView.
While that retest was playing out, a falling trendline had formed connecting the swing high to the lower highs that followed.
Price tagged that trendline more than once and respected it every time, until a strong volume candle finally pushed through it.
If that trendline breakout holds, the Shiba Inu price prediction leans bullish toward the next resistance band, and the Wolfe Wave pattern on this timeframe measures out a level near 0.00000600.
If instead the price gets turned away at the first resistance around 0.00000532, expect a pullback toward the support shelf near 0.00000436 rather than an immediate continuation higher.
Support and Resistance Levels
These are the key chart-derived levels shaping the Shiba Inu price prediction right now.
Type | Level |
Resistance | 0.00000670 |
Resistance | 0.00000583 |
Resistance | 0.00000532 |
Current Price | 0.00000498 |
Support | 0.00000436 |
Support | 0.00000405 |
Bull, Base, Bear Case
For this shiba inu price prediction, three scenarios stand out on the daily chart, and each one hinges on how price behaves around the current resistance shelf.
Case | level | Rationale | Invalidation |
Bull | 0.00000600 | The trendline breakout came on strong volume, and the Wolfe Wave measured move lines up with this zone. | Daily close back below 0.00000436 |
Base | 0.00000532 | Nearest resistance shelf, a natural pause point right after the breakout candle | Loss of the 0.00000480 area on a daily close |
Bear | 0.00000436 | Rejection at first resistance sends the price back to retest the old support shelf. | Daily close under 0.00000405 |
Glossary
Demand Zone: A price area where buying pressure has historically stepped in hard enough to reverse a decline.
Trendline Breakout: What happens when price finally pushes through a sloping line of resistance or support that had been holding for a while.
Wolfe Wave: A five-wave chart pattern traders use to project a measured price level once the structure completes.
Liquidation: The forced closing of a leveraged position when losses eat through the trader's margin.
Burn Rate: The pace at which tokens get permanently removed from circulation, usually tracked over a rolling 24-hour window.
Methodology
This Shiba Inu price prediction is built from multi-source data, including daily timeframe chart analysis, live liquidation figures, exchange volume distribution, and current burn activity. Price levels referenced here come directly from chart structure and are not extrapolated beyond what the data shows. Markets move fast, so treat these levels as a framework rather than a fixed outcome.
Disclaimer: This article is for informational purposes only and does not constitute financial advice. Cryptocurrency markets, including Shiba Inu, are highly volatile and carry significant risk. Always do your own research and consult a licensed financial advisor before making investment decisions.
Also read:










.webp)






