Celestia Price Prediction: Is TIA About to Make Its Biggest Move Yet?


Celestia has been coiled inside a shrinking pattern for weeks, the kind of setup that tends to end quietly right up until it does not.
TIA just closed a candle at the top of that structure with volume that traders could not ignore.
This Celestia price prediction looks at what that move, the derivatives data, and the daily chart are signaling as the next move.
What Is Celestia (TIA) Market Cap and Volume Right Now?
According to CoinMarketCap data, $TIA is priced at $0.3874, up 11.48% over the past 24 hours.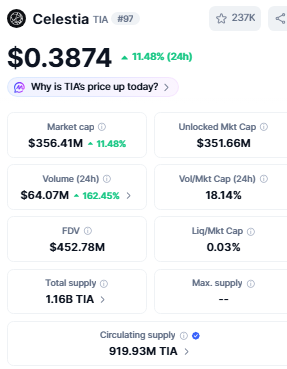
Market cap stands at $356.41 million, also up 11.48%, while unlocked market cap sits at $351.66 million.
Fully diluted valuation is $452.78 million. Total supply is 1.16 billion $TIA with no fixed max supply, while circulating supply is 919.93 million $TIA.
Trading volume over the past day jumped to $64.07 million, up 162.45%, pushing the volume to market cap ratio to 18.14%, a sign of real participation behind the move.
What Does Derivatives Data Show for TIA?
According to Coinglass data, open interest sits at $54.83 million, tracking close to its recent range highs after climbing steadily off the lows seen in early June.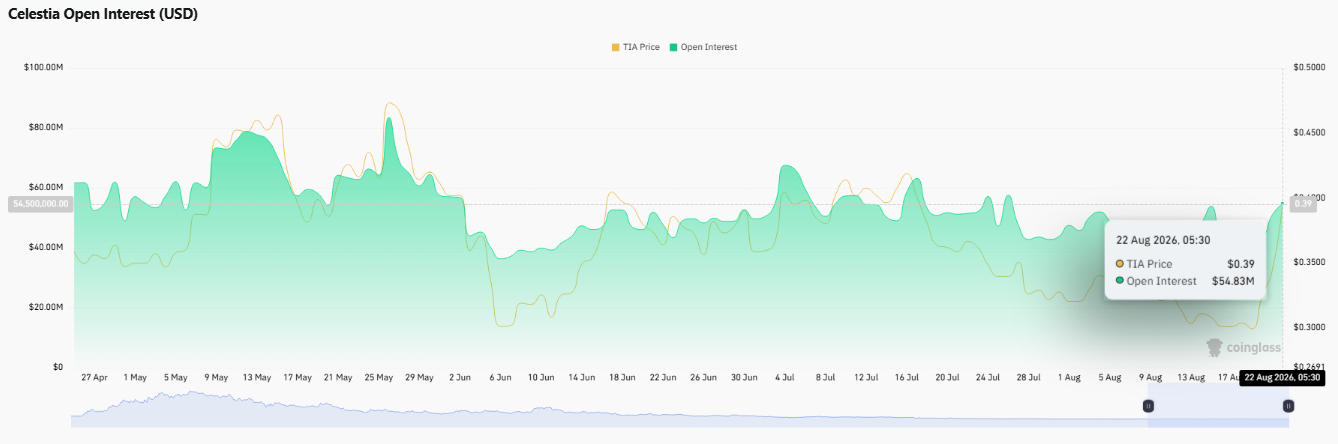
$TIA performance shows a 6.97% pullback over 4 hours despite gains of 11.15% over 24 hours and 25.97% over 7 days.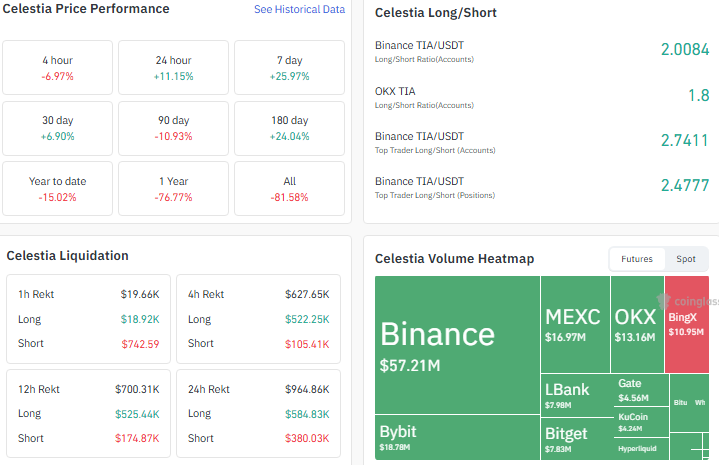
The 30-day change is a milder 6.90%, the 90-day figure is negative at -10.93%, and the 180-day change is positive again at 24.04%. Year-to-date (-15.02%), 1-year (-76.77%), and all-time (-81.58%) figures remain deeply negative.
Futures volume is led by Binance (18.78M) and MEXC ($16.97M).
Long/short account ratios lean heavily toward longs on Binance (2.0084) and OKX (1.8), with Binance top traders even more skewed at 2.7411 by accounts and 2.4777 by positions.
Liquidations totaled 584.83K, outweighing shorts ($380.03K).
What Does the TIA Daily Chart Pattern Reveal?
According to the TradingView chart, TIA had been trading inside a descending triangle for over a month, with lower highs pressing against a flat support line near $0.30.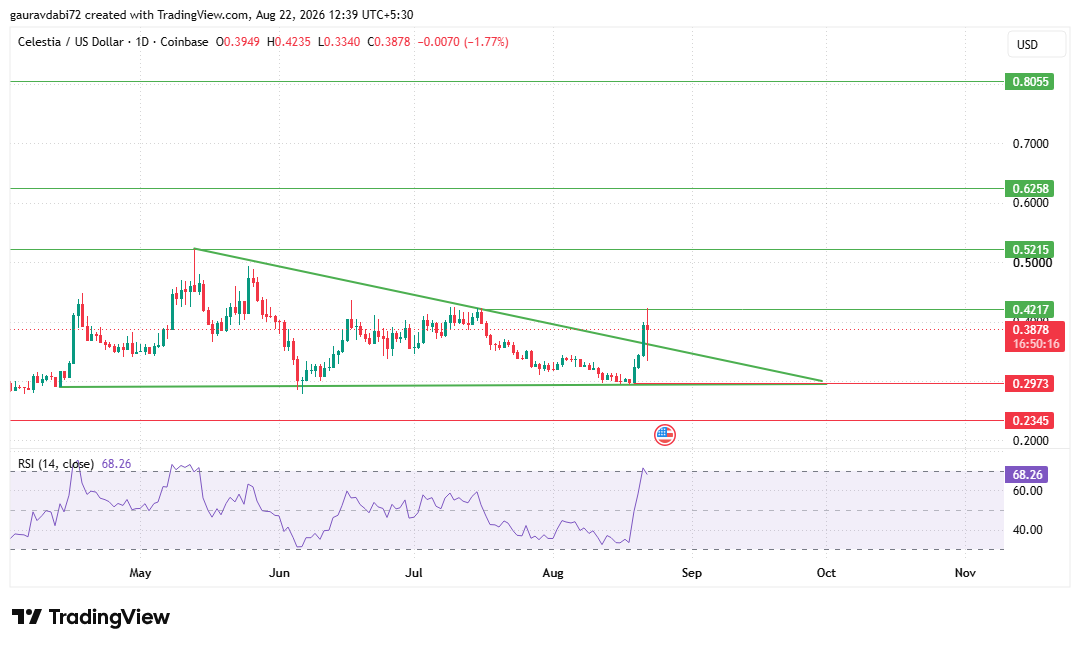
The candle closed right at the triangle's upper resistance, and the 14-period RSI sits at 68.26, firm but not yet in overbought territory, leaving room for further upside before momentum gets stretched, in contrast to some recent breakouts across the sector, where RSI was already deep into overbought levels before the move even started.
A confirmed close above the triangle's resistance opens the door toward $0.4217, then $0.5215, $0.6258, and $0.8055 further out if buyers stay in control.
Should the breakout fail to hold, $TIA support and resistance levels put the psychological floor at $0.2973, with $0.2345 as a deeper level below that.
This $TIA price prediction treats $0.4217 as the level that confirms the breakout is genuine rather than a false move at the triangle's edge.
Is TIA Bullish or Bearish After This Breakout Attempt?
As per the CoinGabbar analyst. The combination of a multi-week consolidation, a resistance-testing close, and long-skewed derivatives positioning points to constructive near-term momentum for $TIA, though the move still needs a clean daily close above $0.4217 to be treated as confirmed rather than a wick into resistance.
The analyst also notes that $TIA remains deeply negative on a yearly and all-time basis, so this breakout attempt is being read as an early recovery signal within a longer downtrend rather than a reversal.
What Is the Celestia Price Prediction for the Coming Weeks?
Scenario | Trigger | |
Bullish | $TIA closes convincingly above $0.4217, then $0.5215, $0.6258, eventually $0.8055 | |
Neutral | Price stalls just under resistance while RSI works off recent gains Range-bound near $0.4217 | |
Bearish | Breakdown back toward $0.2973 $0.2345 psychological level back in focus |
This Celestia price prediction reflects the chart and derivatives data available at the time of writing and is not investment advice.
Disclaimer: This article is for informational purposes only and does not constitute financial, investment, or trading advice. Cryptocurrency markets are highly volatile, and prices can change rapidly. Readers should conduct their own research and consult a qualified financial advisor before making any investment decisions.











.webp)





