Shiba Inu Price Prediction: $SHIB Eyes Breakout After Japan Boost

Shiba Inu launched in 2020 as a meme token on Ethereum and grew into one of the most traded dog-themed coins in crypto.
$SHIB now trades around $0.000005376, holding a tight range after a volatile stretch earlier this year.
Live Market Data
Here's the live snapshot behind this Shiba Inu price prediction.
Metric | Value |
Price | $0.000005376 |
24h Change | +1.7% |
Market Cap | $3.166B |
Fully Diluted Valuation | $5.372B |
24h Volume | $107.768M |
Circulating Supply | 589.239T |
Total Supply | 589.496T |
Source: $SHIB market cap data taken from Coingecko, data as of Aug 24, 2026. Figures may vary slightly across other tracking websites.
Liquidation Snapshot
Liquidation data for this Shiba Inu price prediction shows longs taking the bigger hit recently.
Over 24 hours, $216.55K in SHIB positions got liquidated, split between $130.51K in longs and $86.04K in shorts. 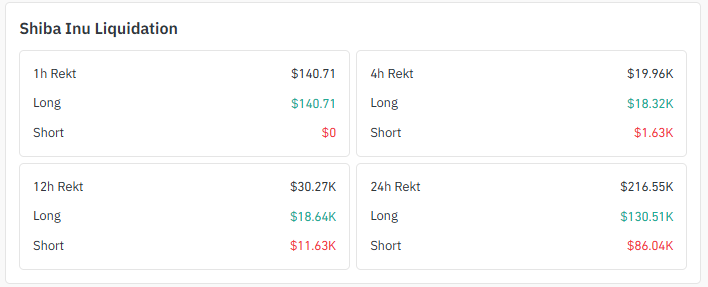
Source: Liquidation Data Taken From Coinglass.
The 1h window was almost entirely long liquidations, while 4h saw $18.32K in longs wiped versus $1.63K in shorts.
This suggests leveraged longs got shaken out on the pullback, which can set up sharper bounces once pressure clears.
Exchange Volume
Futures volume for SHIB is fairly spread out, led by OKX at $30.26M, LBank at $17.63M, and MEXC at $15.25M.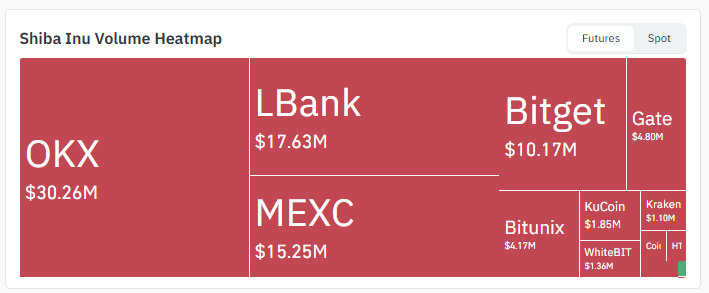
Source: Volume Heatmap Data Taken From Coinglass.
Bitget adds $10.17M, while Gate, Bitunix, KuCoin, Kraken, and WhiteBIT round out the rest.
This spread means $SHIB moves aren't driven by one exchange alone.
Shiba Inu News
Shiba Inu Coin News just picked up support from a Nomura-backed digital asset platform in Japan, joining a small group of tokens cleared under its regulatory registration. 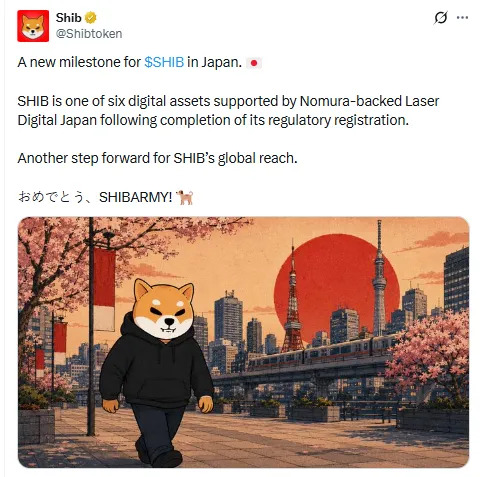
Source: $SHIB Data Taken From @Shibtokens, X Account.
The community is treating it as another sign of SHIB's growing reach beyond its meme coin roots.
Key Takeaways
This Shiba Inu price prediction shows SHIB trading near $0.000005376, up 1.7% in the last 24 hours.
Price broke out of two descending channels on the daily chart and is respecting a rising trendline.
Resistance sits at $0.00000670, with $0.00000736 and $0.00000811 as extended levels.
A daily close below $0.00000486 could send the price into the FVG zone near $0.00000440.
SHIB just landed support from Nomura-backed Laser Digital Japan, adding fresh bullish buzz.
Technical Analysis: Daily Chart Analysis For SHIB
Double Descending Channel Breakout
The daily chart shows $SHIB breaking out of two descending channels back to back.
The first breakout pushed the price into a fresh range, and a second, tighter channel formed right after, which the price has now also cleared.
Two clean breakouts in a row usually signals sellers losing grip, and it's a big part of why this Shiba Inu price prediction leans cautiously bullish.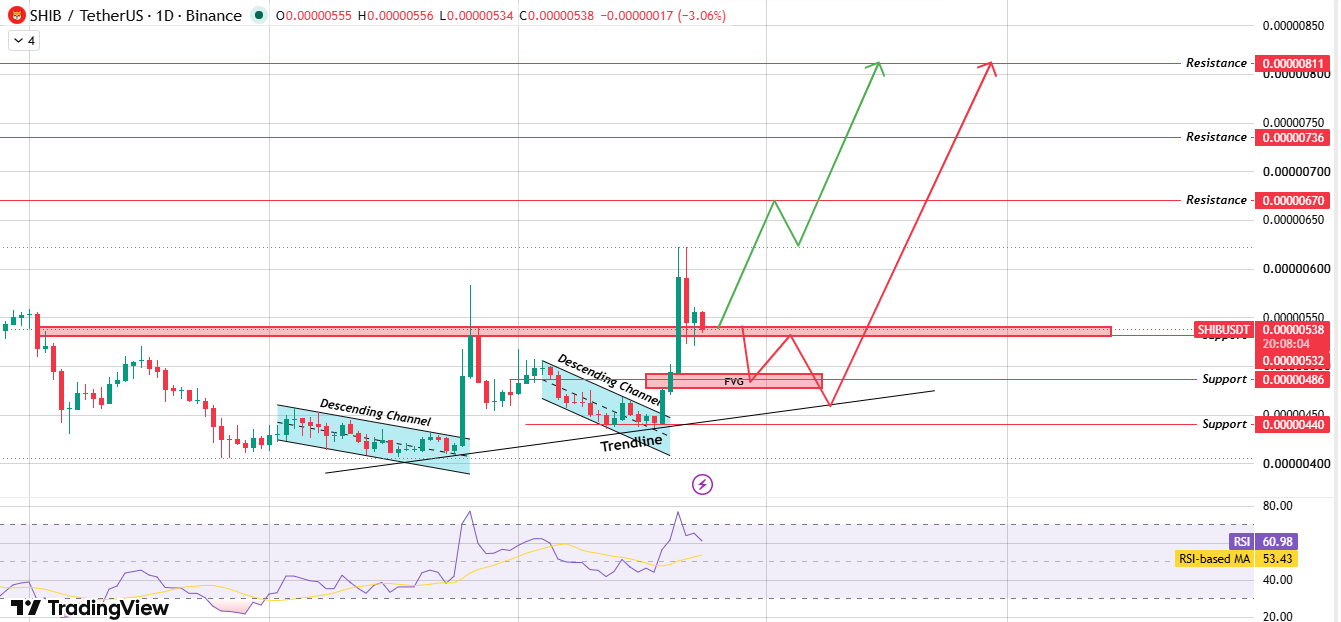
Source: Chart Taken From TradingView.
Rising Trendline Support
$SHIB is also respecting a rising trendline connecting recent swing lows.
As long as the price stays above it, dips are more likely to get bought than sold.
A daily close clearly below the trendline would weaken this setup and open the door to a deeper pullback toward the FVG zone.
Current Price Setup
Price is currently sitting right on a support and resistance flip zone near $0.00000538. Two things can happen from here.
Strong volume coming in could push SHIB toward the $0.00000670 resistance and beyond.
Alternatively, if this zone breaks down, price will likely dip into the fair value gap around $0.00000486, and a bounce from there would still keep the broader trendline structure intact.
Daily Support and Resistance Levels
Level Type | Price |
R3 | $0.00000811 |
R2 | $0.00000736 |
R1 | $0.00000670 |
Current Zone | $0.00000538 |
S1 | $0.00000486 |
S2 | $0.00000440 |
Bull, Base, Bear Case
This Shiba Inu price prediction breaks the setup into three simple scenarios.
Setup | Trigger | Level |
Bull | Daily close above $0.00000670 | $0.00000736 to $0.00000811 |
Base | Price holds the $0.00000538 to $0.00000670 range. | Sideways chop, range trade |
Bear | Daily close below $0.00000486 | FVG fill near $0.00000440 |
Glossary
Descending Channel: A chart pattern formed by two parallel downward-sloping lines that contain price action during a downtrend.
Fair Value Gap (FVG): A price zone left behind by a sharp move where buying and selling volume was thin, often revisited later.
Trendline: A line drawn across price highs or lows that shows the general direction of a trend.
Liquidation: The forced closing of a leveraged trading position when losses hit a certain threshold.
RSI: Relative Strength Index, a momentum indicator used to gauge whether an asset is overbought or oversold.
Methodology
This Shiba Inu price prediction is based on daily timeframe chart analysis, current liquidation data, exchange volume distribution, and live market data at the time of writing.
Levels are drawn directly from chart structure and are not extrapolated beyond visible price action.
Disclaimer: This article is for informational purposes only and does not constitute financial advice. Cryptocurrency markets, including Shiba Inu, are highly volatile and carry significant risk of loss. Always do your own research and consult a qualified financial advisor before making any investment decisions.












.webp)




