Dash Price Prediction: Why $DASH is Up Today? Key Target Levels


Dash is roaring back today. DASH just jumped over 20%, breaking clean out of a months-long slide, and renewed attention on its treasury model is adding fuel.
This Dash Price Prediction covers what's driving the move and the levels that matter most right now.
Market data was checked on August 22, 2026, at 1:45 IST.
DASH Live Price and Market Stats
Metric | Value |
Price | $41.17 |
24h Change | 20% |
Market Cap | $529.7M |
FDV | $778.16M |
24h Volume | $233M+ |
Vol/Mkt Cap (24h) | 44.22% |
Total Supply | 12.81M DASH |
Max Supply | 18.9M DASH |
Circulating Supply | 12.81M DASH |
Source: Data from CoinMarketCap as of August 22, 2026, at 01:45 IST. Figures may vary slightly across other tracking websites.
$DASH crypto news today: Why $Dash Is in Focus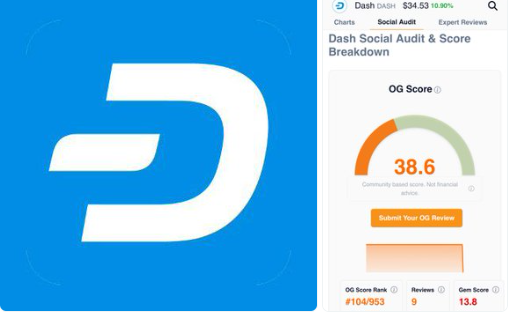
Source: Data From X
Analyst account OGAudit highlighted $Dash's treasury model, noting its self-funding budget now gets 20% of every block reward, doubled from 10% in 2023.
The thread also pointed to Dash's two-tier masternode structure, InstantSend confirmations in under two seconds, and ChainLocks protection against 51% attacks as differentiators.
This is analyst commentary, not official Dash Core news, though the underlying protocol details are part of Dash's documented design.
$DASH Price Prediction Chart: Technical Analysis
Pair: DASH/USDT · Market: Spot (Crypto) · Exchange: OKX · Timeframe: 1D · Source: TradingView · Timestamp: August 22, 2026, 12:42 UTC+5:30
$DASH broke out sharply from the 36.05 to 38.72 range, spiking to a high of $47.50 before settling at $41.17, up 20% after a steady downtrend since May.
RSI sits at 79.23, deep overbought territory, signaling a stretched move after weeks of decline.
The EMA cluster sits well below price, acting as a longer-range floor.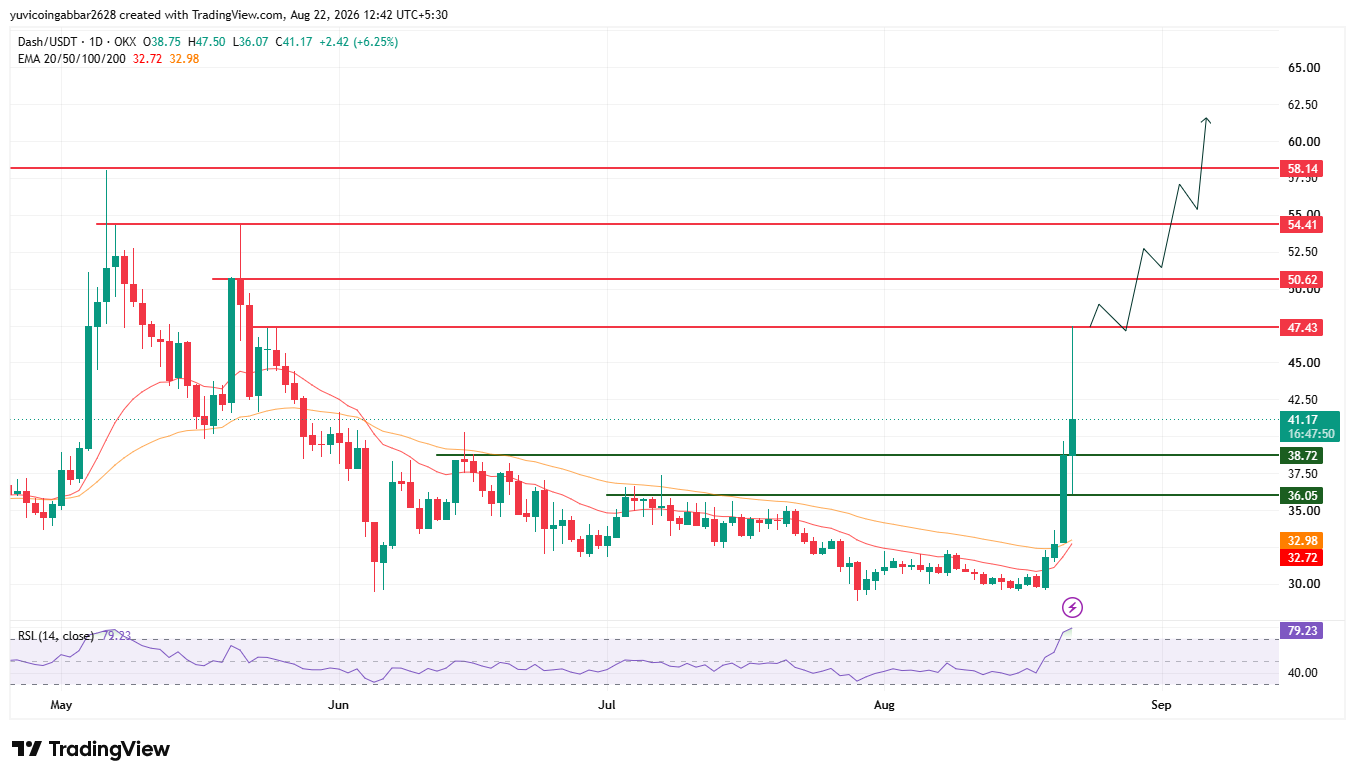
$DASH breakout rally: Support and Resistance Levels
Level Type | Price |
Resistance 4 | $58.14 |
Resistance 3 | $54.41 |
Resistance 2 | $50.62 |
Resistance 1 (nearest) | $47.43 |
Immediate Price Reference | $41.17 |
First Support | $38.72 |
Deeper Support | $36.05 |
$Dash Liquidation and Volume Data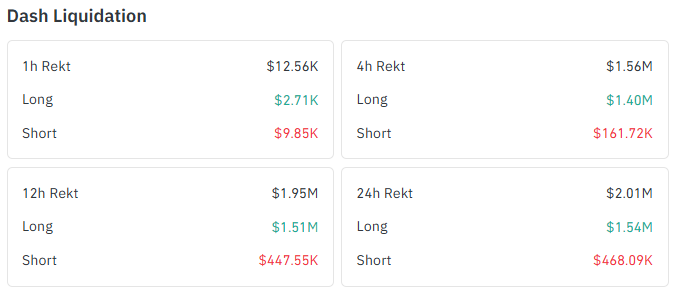
Coinglass data shows long liquidations dominating across every window as leveraged shorts got squeezed hard.
Timeframe | Total Liquidated | Long Liquidations | Short Liquidations |
1h | $12.56K | $2.71K | $9.85K |
4h | $1.56M | $1.40M | $161.72K |
12h | $1.95M | $1.51M | $447.55K |
24h | $2.01M | $1.54M | $468.09K |
The 4h–24h windows show longs far outweighing shorts, suggesting leveraged longs got flushed near the day's high before the pullback.
$Dash Forecast 2026: Bull Case vs. Bear Case
$DASH price target 2026 Bull case: Holding above $38.72 keeps today's breakout intact. A close above $47.43 opens the path toward $50.62 and $54.41.
$DASH price target 2026 Bear case: A break below $38.72 would suggest the rally is fading, especially with RSI this overbought. Losing $36.05 puts the breakout in serious doubt.
$DASH future price: $DASH Price Prediction Scenarios
Scenario | Trigger | Likely Outcome | Invalidation Point |
Breakout continuation | Close above $47.43 | Move toward $50.62 | Rejection at $47.43 |
Range hold | Price holds 38.72–47.43 | Consolidation before the next leg | Break outside either bound |
Breakout failure | Close below $36.05 | Retest of EMA zone near 32–33 | Reclaim of $38.72 |
$DASH price target: Can $DASH Reach $58?
$58.14 is the highest marked resistance.
Reaching it needs $DASH to clear $47.43, $50.62, and $54.41 in sequence, a multi-stage move, especially with RSI already stretched at 79.23.
$Dash Coin Long-Term Chart Levels to Watch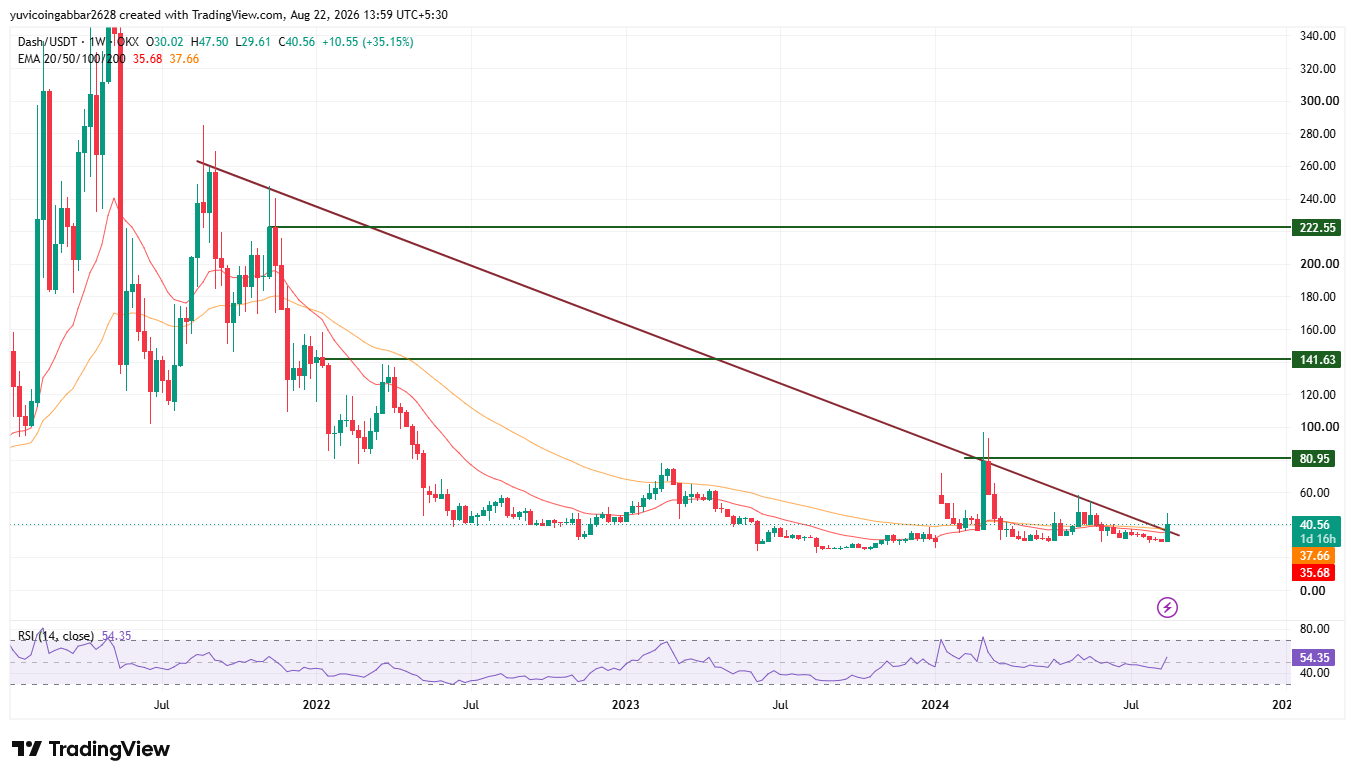
4DASH Long-Term Price Levels
Timeframe | Price Target |
2026 – 2027 | $80.95 |
2027 – 2028 | $141.63 |
2028 – 2030 | $222.55 |
Is $222.55 Realistic for DASH?
Reaching $222.55 isn't a near-term expectation.
It sits far above where DASH trades today and would only come into play if the broader altcoin market enters a strong, sustained bull phase, similar to past cycles where alts saw multi-year rallies.
Without that kind of market-wide strength, this level stays out of reach. It's a long-term possibility tied to overall market conditions, not something the current chart alone supports.
$Dash Price Prediction: Expert View
According to CoinGabbar analysts, today's breakout came on strong volume alongside renewed attention on Dash's treasury and masternode economics.
RSI above 79 signals the move is stretched, so a cooldown is likely before any further push.
The $38.72 to $47.43 zone is the key range to watch next.
Disclaimer: This piece is for informational purposes only and isn't financial advice. Levels and scenarios are based on technical chart analysis and public data at the time of writing; markets can move sharply within hours. It's worth doing independent research and considering your own risk tolerance before acting on any levels discussed here.
Also read:











.webp)





