Movement Price Prediction: Can MOVE Hold Its Breakout After 32% Surge?


Nobody Saw This Coming, Then Everyone Did
A quiet, beaten-down altcoin just woke up. Trading desks noticed the volume spike before headlines caught up, and by the time most retail traders checked their screens, the move was already underway.
There's a specific chart pattern that makes traders sit up: weeks of grinding lower, a tight coil, then a clean breakout candle. So what triggered this move, and what does it mean for this Movement price prediction 2026? Does it have legs?
Key Takeaways
$MOVE jumped roughly 32-40% in 24 hours, breaking out of a multi-week descending channel.
The rally is driven by a broad altcoin rotation and a spike in $MOVE trading volume, not a project-specific announcement.
Whale concentration sits above 96%, a real risk for anyone chasing this $MOVE coin price move.
Our base case sees consolidation between the breakout zone and the next resistance band.
Invalidation for the bullish structure sits below the recent swing low near $0.0057.
For the latest $MOVE crypto news and ongoing coverage of this rally, the crypto news updates page tracks it as the story develops.
Why Is Movement's Price Moving Today
MOVE is trading near $0.00932 as of August 22, 2026, 15:43 UTC, up close to 40% on a 24-hour basis. Anyone tracking live price prediction updates across altcoins will recognize this pattern from recent sessions.
The primary driver looks like a broad altcoin rotation. Capital moved out of large caps and into higher-beta tokens, and $MOVE had more room to run. Volume over 24 hours jumped more than 550% to roughly $54.9 million, a sign this wasn't a thin-liquidity wick. Low-float coins with fresh volume tend to move fastest once buyers show up.
Movement crypto latest news flow has been light this week, telling us the rally is liquidity-driven and market-wide rather than headline-driven, a pattern visible across the wider memecoin and altcoin news cycle too.
Movement Price Today: Market Data Snapshot
As of August 22, 2026, 15:43 UTC:
Metric | Value |
Price | $0.009320, up roughly 39.86% in 24 hours |
Market cap | $40.36 million, up around 40.37% |
Volume (24h) | $54.9 million, up 741.82% |
Volume-to-market-cap ratio | 125.66% |
Fully diluted valuation (FDV) | $93.54 million |
Circulating supply | 4.33 billion MOVE |
Total and max supply | 10 billion MOVE |
24h range | Low $0.006637, High $0.00947 |
All-time high | $1.45 (December 10, 2024) |
All-time low | $0.005738 (August 19, 2026) |
A ratio above 100% is unusual; trading activity over the day exceeded the entire market cap, a sign of a genuinely hot session. For live figures, the MOVE market data on CoinMarketCap is worth bookmarking.
Movement Technical Analysis: Chart Breakdown
The daily MOVE/USDC TradingView chart shows a descending channel $MOVE has been trapped in since early July: lower highs, lower lows, and a downtrend. 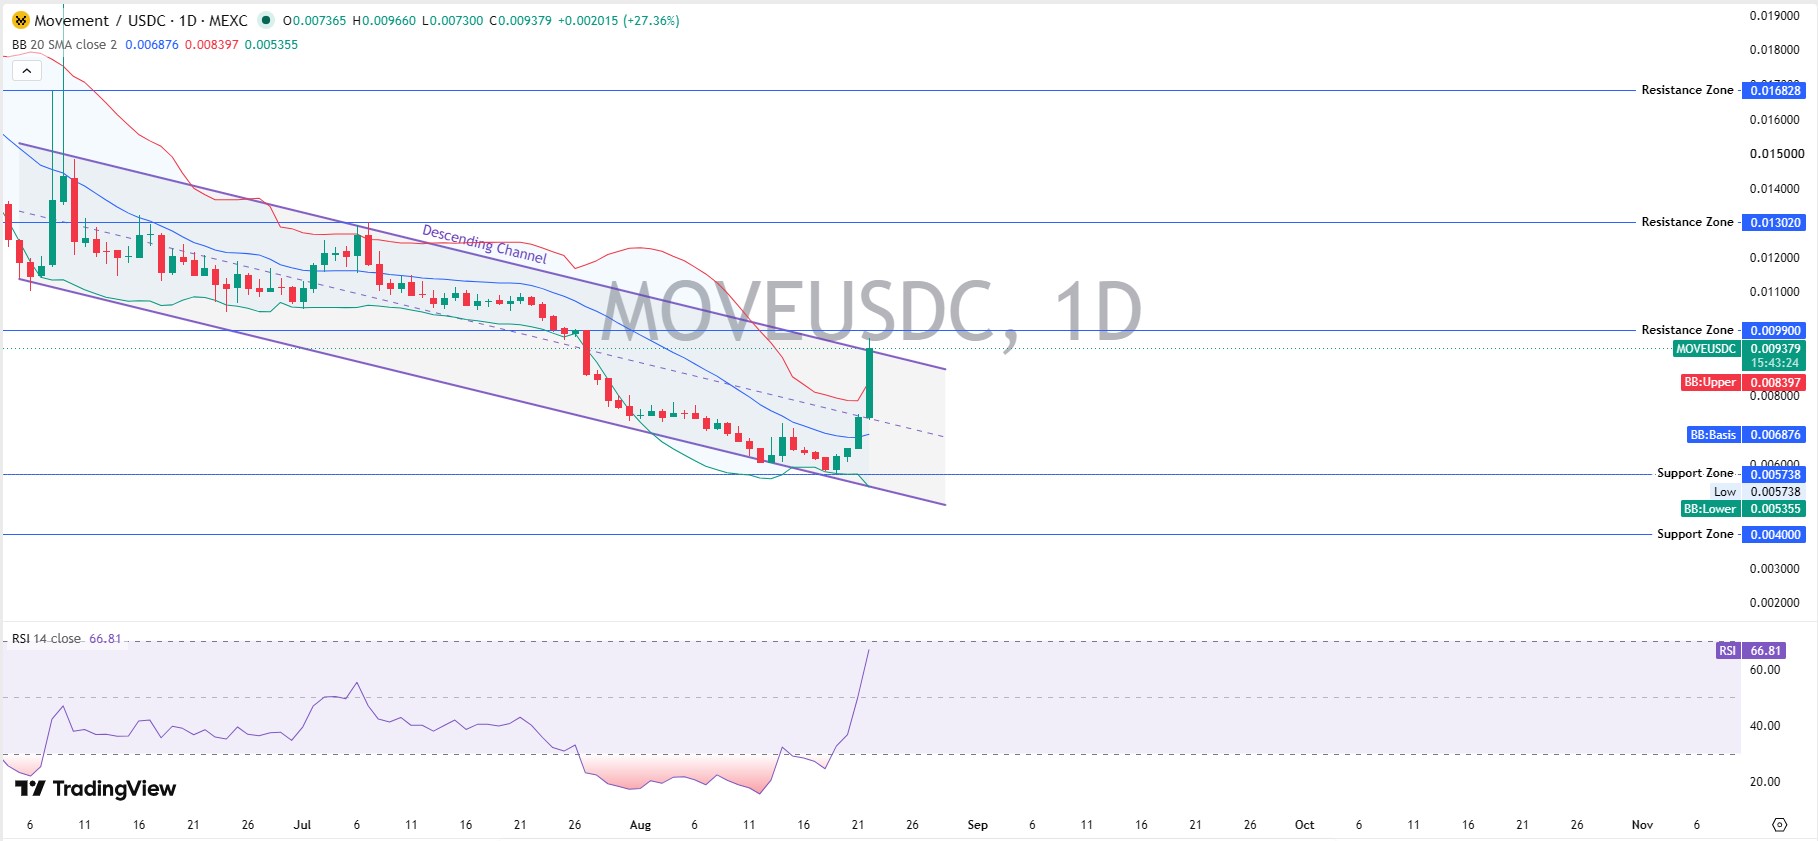
That changed this session, with $MOVE punching through the upper boundary on a large green candle, moving from around $0.00737 to a high near $0.00966.
RSI 14 sits at 66.81, firmly bullish without being overbought. Resistance sits in three bands: $0.009900, then $0.013020, then $0.016828. Support sits at $0.005738, backed by a lower zone at $0.004000. A daily close above $0.009900 would confirm the breakout on the higher timeframe.
The chart's Bollinger Bands, which plot a moving average with upper and lower bands based on volatility, also widened as price broke out, with the candle pushing straight into the upper band near $0.008397, a sign of strong momentum rather than a low-volatility drift.
Is MOVE an Altcoin Worth Watching
MOVE sits in the Layer 2 and modular blockchain category, and that matters for how it trades. Altcoins with sub-$50 million market caps swing harder than majors like Bitcoin price action. A 32% daily move that's extraordinary for a top-ten coin is ordinary for a token this size, and it cuts both ways in risk-off sessions.
Movement Tokenomics and Whale Concentration
MOVE has a max total supply of roughly 8.9 billion tokens on the tracked contract, with 39,174 holders. Top 100 wallets control 99.07% of supply, and whale-classified wallets alone hold 96.12% despite being just 0.13% of holders. 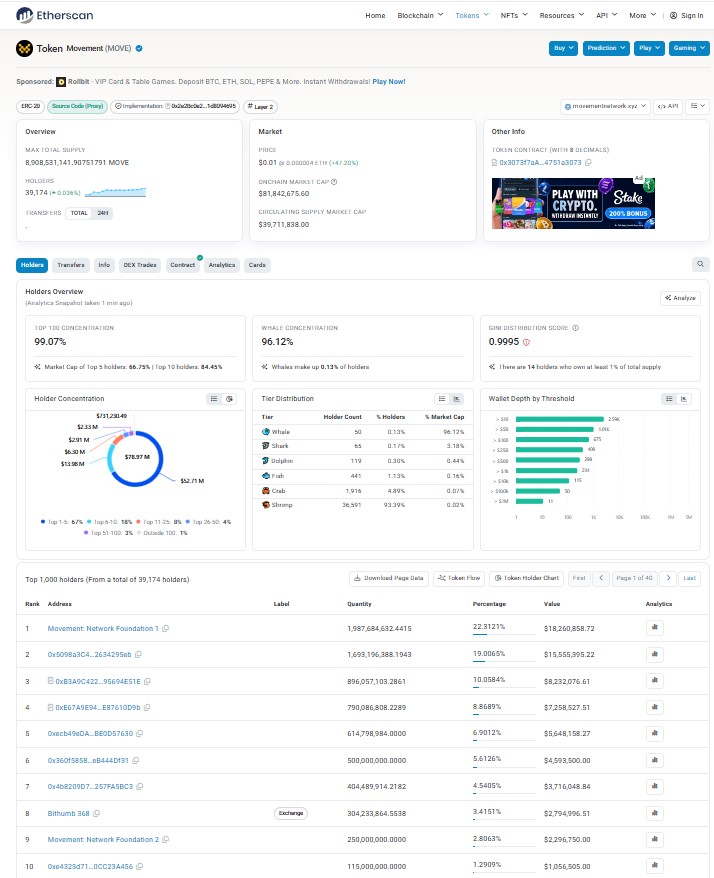
The Gini score sits at 0.9995, about as concentrated as it gets, with fourteen holders each controlling at least 1% of supply on their own.
That's not automatically a red flag, since treasury and vesting wallets often explain heavy concentration, but it means large wallet moves can swing price fast. Reviewing the token holder distribution on Etherscan before trading a breakout is a reasonable habit.
Liquidity, Volume, and Leverage Risk
24-hour liquidations totaled $296.56K, with longs absorbing $187.98K and shorts taking $108.58K. In the last four hours alone, $223.35K got liquidated, mostly longs caught by volatility. 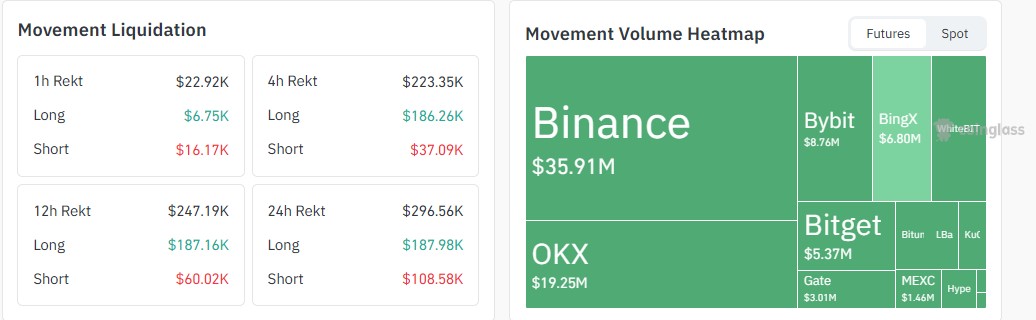
Volume concentrated heavily on Binance at $35.91 million, followed by OKX and Bybit. That much leverage around a low-cap breakout raises the odds of sharp two-way wicks ahead, tracked in near real time via CoinGlass liquidation data.
Movement Price Prediction: Bear, Base, and Bull Scenarios
Timeframe | Bear Case | Base Case | Bull Case | Probability | Invalidation |
7 Days | $0.0068 | $0.0088 | $0.0110 | Bear 30% / Base 45% / Bull 25% | Daily close below $0.0072 |
30 Days | $0.0057 | $0.0105 | $0.0135 | Bear 25% / Base 45% / Bull 30% | Weekly close below $0.0057 |
Early 2027 | $0.0045 | $0.0130 | $0.0230 | Bear 25% / Base 40% / Bull 35% | Sustained trading below $0.0040 |
These targets follow from the technical structure above: the breakout, layered resistance zones, and the support shelf near the all-time low.
None are guarantees, and every scenario should be weighed against the liquidity and whale-concentration risks already covered. Broader shifts, like those tracked in recent Clarity Act coverage, can move altcoin sentiment too.
Risks to This Movement Price Prediction
Whale wallets moving even a small percentage of holdings onto exchanges could pressure price hard, given how concentrated supply is. Leverage is elevated, and today's liquidation data shows longs already getting squeezed on pullbacks; a broader macro shift, including any surprise from upcoming Fed policy decisions, would hit a low-cap altcoin like MOVE hard.
Rotations like today's also tend to fade once momentum traders take profit; if volume dries up, the breakout could stall at the $0.0099 zone. Traders watching where $MOVE trades next can check the crypto exchange listings page.
Keeping an eye on the coin events calendar is also useful, since scheduled unlocks or listings can explain volume spikes like this one before they show up in price.
Disclaimer
This article is for informational purposes only and does not constitute financial, investment, or trading advice. Cryptocurrency markets, including Movement (MOVE), are highly volatile, and prices can move sharply in either direction. Always do your own research and consult a licensed financial advisor before making any investment decisions. Data referenced here was sourced from CoinMarketCap, CoinGlass, and Etherscan at the time of writing and may change quickly.











.webp)





