Pi Network Price Prediction: $1B Cap Back, Chart Sets Up Big Move


Pi Network is a mobile mining-based cryptocurrency project that began as a phone app in 2019 before its mainnet token, PI, launched for open trading in 2025.
It currently trades around $0.0954. This Pi network price prediction examines where PI could head next based on its daily chart structure, trendline behavior, and recent market cap developments.
Live Market Data
Metric | Value |
Price | $0.0954 |
24h Change | +1.1% |
24h Range | $0.08764 - $0.1106 |
$1.057B | |
Fully Diluted Valuation | $1.627B |
24h Trading Volume | $29.257M |
Circulating Supply | 11.092B |
Total Supply | 17.064B |
Max Supply | 100B |
Source: $PI market cap data taken from Coingecko, data as of Aug 22, 2026. Figures may vary slightly across other tracking websites.
Social Sentiment of $PI
Market Cap Milestone: PI's market capitalization has climbed back above the $1 billion mark after several weeks spent below it.
The move is being described as modest rather than explosive, since $PI is up only around 6% over the past week even as other assets posted sharper double-digit gains recently. 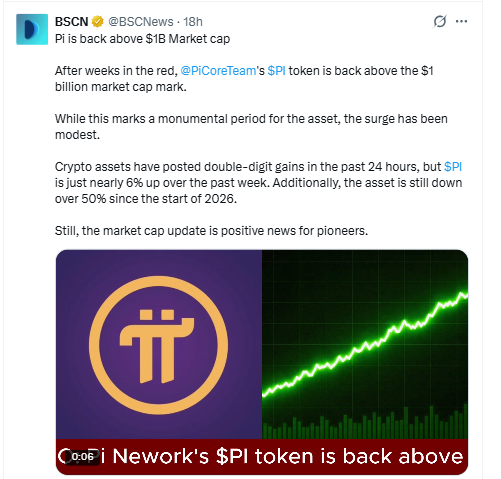
Source: Data Taken From @BSCNews, X Account.
It's worth noting $PI remains down more than 50% since the start of 2026, so this milestone reads more as stabilization than a full recovery, though it's still a welcome shift for long-term holders.
Key Takeaways
PI trades near $0.0954, up 1.1% over 24 hours, after a liquidity grab below its rising daily trendline was followed by a bounce.
This Pi network price prediction hinges entirely on whether that bounce holds or the trendline finally gives way.
A successful bounce keeps the path open toward $0.11445, then $0.12467 and $0.13423.
A failed bounce and a trendline break would expose $0.08478 and $0.08020 as the next support levels.
PI's market cap just reclaimed the $1B mark after weeks in the red, though the asset remains down over 50% since the start of 2026.
Technical Analysis
Daily Chart: Trendline Holds Through a Liquidity Grab
PI has been respecting a rising trendline on the daily chart for a while now, and the latest test came with a twist.
Price dipped below the trendline just long enough to grab liquidity resting under it, then snapped back above, a classic sweep-and-reclaim move rather than a clean breakdown. 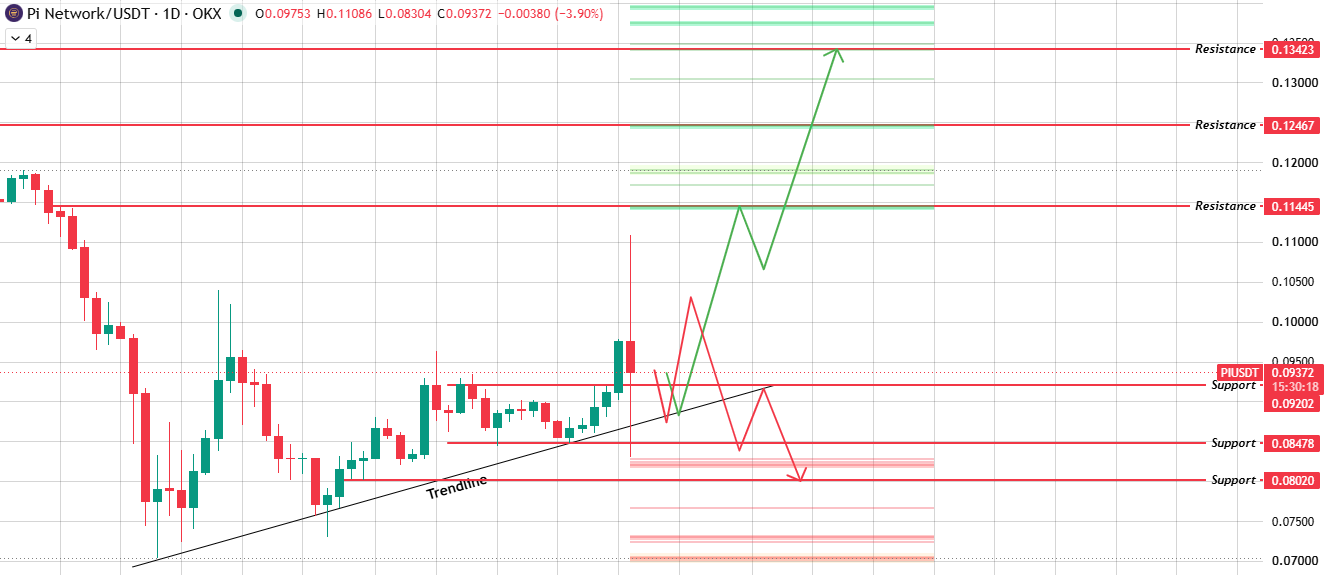
Source: Chart Taken From TradingView.
This Pi network price prediction now comes down to whether that bounce actually sticks.
If buyers keep control and the trendline holds as support, price has a path toward $0.11445 first, with $0.12467 and $0.13423 in view if momentum extends.
But if this bounce fails and the trendline breaks properly this time, PI risks sliding toward $0.08478, with $0.08020 as the next support if selling pressure builds further.
Support and Resistance Levels
Level Type | Price |
Resistance 3 | $0.13423 |
Resistance 2 | $0.12467 |
Resistance 1 | $0.11445 |
Current Price | $0.0954 |
Support / Trendline Zone | $0.09202 |
Support 1 | $0.08478 |
Support 2 | $0.08020 |
Bull, Base, and Bear Case
Scenario | Setup | level | Invalidation |
Bull | Bounce off the trendline holds, and buyers regain control. | $0.11445 - $0.13423 | Below $0.09202 |
Base | Price chops around the trendline zone, deciding direction. | $0.09202 - $0.11445 | Break of $0.08478 |
Bear | Bounce fails, and the trendline breaks decisively. | $0.08478 - $0.08020 | Below $0.08020 |
Glossary
Rising Trendline: An upward-sloping line connecting a series of higher lows on a chart. As long as the price keeps bouncing off it, it's treated as active support.
Liquidity Grab: A short, sharp move where price pokes below a key support level to trigger stop-loss orders sitting there before quickly reversing back above it. Often seen as a bullish trap for sellers rather than a genuine breakdown.
Bounce: A short-term reversal off a support or resistance level. Whether a bounce "holds" or "fails" often determines the next major leg for the asset.
Market Capitalization: The total value of all circulating tokens, calculated by multiplying circulating supply by current price. Crossing a round number like $1 billion is often treated as a psychological milestone.
Support Level: A price zone where buying interest has historically been strong enough to slow or reverse a decline.
Resistance Level: A price zone where selling interest has historically been strong enough to slow or reverse an advance.
Methodology
This Pi network price prediction is built from daily chart technical analysis and current market data. All price levels referenced come directly from the chart provided, with no extrapolated or speculative levels.
Disclaimer: This article is for informational purposes only and does not constitute financial, investment, or trading advice. Cryptocurrency markets, including Pi Network, are highly volatile and speculative. Any price levels, levels, or scenarios discussed are probability-based observations drawn from technical data, not guarantees. Please conduct your own research and consult a qualified financial advisor before making investment decisions.











.webp)





