Dogecoin Price Prediction: $DOGE Could Blast Off as ETF Flows Return


Dogecoin (DOGE) is trading at $0.09179, up 2.4% on the day, as price presses directly into the upper boundary of a long-running descending triangle on the weekly chart.
This dogecoin price prediction breaks down what a confirmed breakout or a rejection would mean for price next.
Live Market Data
Here's the live snapshot behind this dogecoin price prediction as of writing.
| Metric | Value |
| Price | $0.09179 |
| 24h Change | +2.4% |
| 24h Range | $0.08902 – $0.09445 |
| Market Cap | $14.285B |
| Fully Diluted Valuation | $15.727B |
| 24h Trading Volume | $938.514M |
| Circulating Supply | 155.622B |
| Total Supply | 171.334B |
| Max Supply | Infinity |
| Total Treasury Holding | 805,037,540 |
Source: Dogecoin market data as of Aug 24, 2026. Figures may vary slightly across other tracking websites.
Liquidation Snapshot
Dogecoin's derivatives market has seen meaningful two-sided liquidation activity as price approaches this key resistance test.
| Window | Total Rekt | Long | Short |
| 1h | $47.75K | $17.63K | $30.12K |
| 4h | $429.92K | $339.16K | $90.76K |
| 12h | $1.66M | $1.25M | $410.36K |
| 24h | $4.90M | $3.16M | $1.73M |
Source: Liquidation data taken from Coinglass.
Over the last 24 hours, longs have taken the bigger hit at $3.16M versus $1.73M in shorts, notable given $DOGE is still up on the day, suggesting some leveraged long positions got shaken out during intraweek volatility even as the broader trend stayed constructive.
Exchange Volume
Exchange | 24h Volume |
Binance | $717.91M |
OKX | $457.14M |
Bybit | $231.52M |
MEXC | $225.24M |
WhiteBIT | $127.82M |
Bitget | $118.01M |
Bitunix | $99.44M |
KuCoin | $37.41M |
Gate | $70.31M |
Source: Volume heatmap data taken from Coinglass.
Binance continues to dominate $DOGE liquidity by a wide margin, with OKX a distant second; together the two exchanges account for the bulk of trading activity around this resistance test.
Dogecoin New Today
Sentiment around $DOGE has picked up alongside the push toward resistance, with capital-flow data and chart-pattern calls both circulating.
Source: Data Taken From @TOPDOGE007, X Account.
Spot Dogecoin ETF flows are back in focus. Commentary highlights that the funds posted their strongest single-day inflow since May, pulling in $654,000 on August 20, marking the first net inflow day since August 4.
The framing: capital is starting to rotate back into Dogecoin after weeks of outflows.
Separately, chart-focused accounts are pointing to a double bottom forming on the weekly timeframe, arguing the broader structure remains bullish even if there's another leg down first, with a breakout still seen as the eventual outcome once the pattern completes.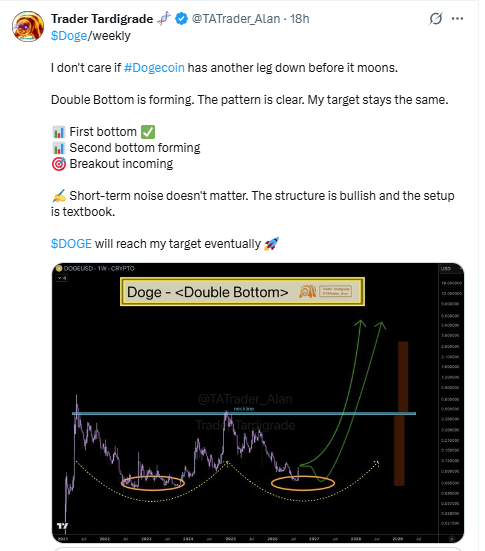
Source: Data Taken From @TaTrader_Alan, X Account.
Both threads point in the same direction: a market watching closely for confirmation that the multi-year downtrend is losing steam, even as near-term price action stays choppy.
Key Takeaways
-
DOGE is testing the upper boundary of a descending triangle on the weekly chart after a multi-year downtrend from the 2021 highs.
-
Price is trading near $0.0918, roughly flat to up on the week after briefly tagging $0.09364.
-
A confirmed weekly close above the descending trendline would open the path toward $0.15651, then $0.28752, with $0.48404 as the stretch level.
-
Rejection at this trendline would likely send the price back toward the $0.06702 support shelf, with $0.04122 as the deeper downside level.
-
Spot ETF inflows just turned positive for the first time since August 4, adding a fundamental tailwind to the technical setup.
-
24-hour liquidations hit $4.90M, with longs taking the larger share at $3.16M.
Technical Analysis: $DOGE Weekly Chart Analysis
For much of the past year, $DOGE has been grinding lower inside a descending triangle, a pattern defined by a flat support shelf near 0.067–0.09 and a downward-sloping trendline connecting a series of lower highs stretching back toward the 2021 peak near $0.48.
Price has just tapped that descending trendline again, with the weekly candle opening at $0.09342, reaching a high of $0.09364, and pulling back to near $0.09149, a small pullback of about 2% on the week. 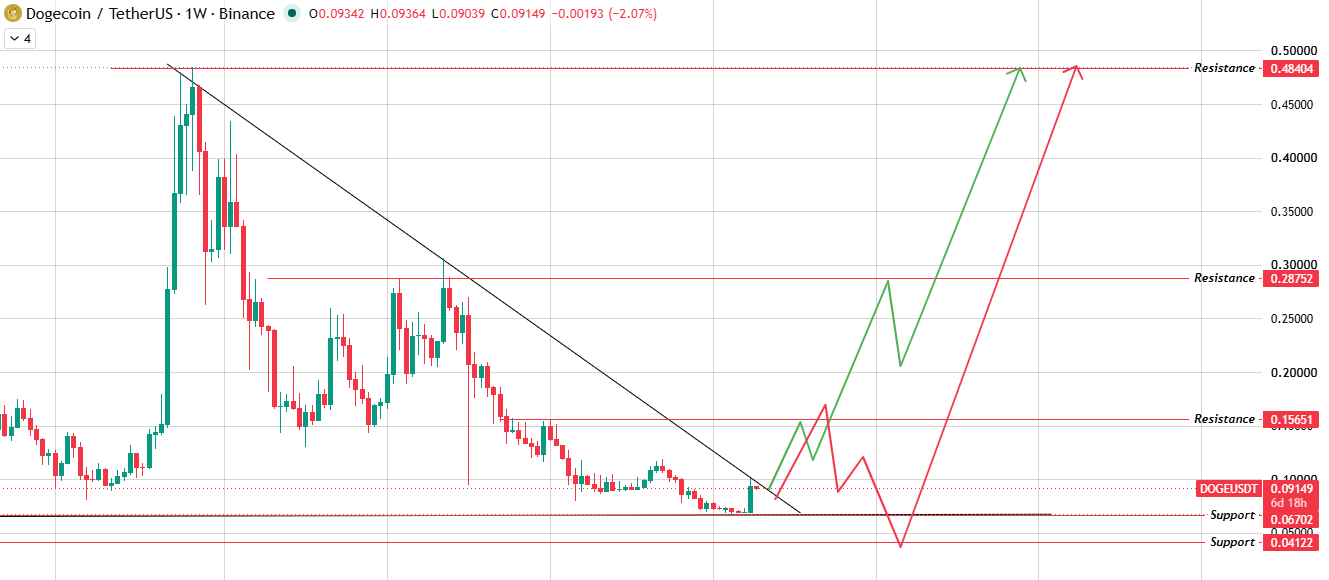
Source: Dogecoin Chart Taken From TradingView .
This puts DOGE right at the decision point of the pattern.
If buyers can force a decisive weekly close above the trendline, the setup favors continuation toward the first resistance band at $0.15651, followed by $0.28752, with the $0.48404 zone near the prior cycle's swing high as the extended level should momentum carry through.
If sellers defend the trendline instead, the more likely path is a pullback into the $0.06702 support shelf that has held for months, with a break of that level opening room down toward $0.04122.
Support and Resistance Levels
Chart-derived levels are shaping this dogecoin price prediction right now.
| Type | Level |
| Resistance | $0.48404 |
| Resistance | $0.28752 |
| Resistance | $0.15651 |
| Current Price | $0.09179 |
| Support | $0.06702 |
| Support | $0.04122 |
Bull, Base, Bear Case
This dogecoin price prediction breaks down into three scenarios depending on how the price handles the descending trendline right above current levels.
| Case | Level | Setup | Invalidation |
| Bull | $0.48404 | Weekly close above the descending trendline confirms the breakout, clearing $0.15651 and $0.28752 en route to the stretch level near the 2021 highs. | Weekly close back below $0.06702 |
| Base | $0.15651 | Price grinds through the trendline but stalls at the first resistance band, consolidating before any larger move. | Loss of the 0.08–0.09 zone on a weekly close |
| Bear | $0.06702 | The trendline holds as resistance, and the price rotates back down into the established support shelf. | Weekly close under $0.04122 |
Glossary
Descending Triangle: A chart pattern with a flat horizontal support level and a downward-sloping resistance trendline, often resolving with a breakout in either direction once price reaches the apex.
Trendline Rejection: When a price approaches a trendline but fails to close beyond it, it reverses back the other way instead.
Liquidation: The forced closing of a leveraged position once losses eat through a trader's available margin.
Spot ETF Inflow/Outflow: The net amount of capital moving into or out of an exchange-traded fund that holds the underlying asset, used as a proxy for institutional demand.
Double Bottom: A reversal pattern formed by two similar lows separated by a peak, generally seen as bullish once the neckline is broken.
Methodology
This dogecoin price prediction draws on multi-source data, including weekly timeframe chart structure, live liquidation figures, exchange volume distribution, and current market data, alongside social sentiment around ETF flows and pattern calls circulating on crypto Twitter/X.
Price levels referenced here come directly from chart structure rather than extrapolation. Markets move fast, so treat these levels as a framework rather than a fixed outcome.
Disclaimer: This article is for informational purposes only and does not constitute financial advice. Cryptocurrency markets, including Dogecoin is highly volatile and carries significant risk. Always do your own research and consult a licensed financial advisor before making investment decisions.












.webp)




