XRP 50-Month EMA Breakout: Is XRP Price Heading Lower?


XRP is trading near $1.08 this week, but the XRP 50-month EMA breakout is now the key technical event shaping the market outlook. But the bigger story is unfolding on the monthly chart, and it is shaping the XRP price prediction 2026 outlook heading into the second half of July.
The altcoin closed June at $1.04, down 22% for the month. That monthly close fell below the $1.26 level that had acted as support since 2023 and also slipped beneath the 50-month exponential moving average (EMA), a benchmark XRP had held above for more than three years without a sustained monthly breakdown.
However, one monthly close below the 50-month EMA does not automatically confirm a long-term breakdown. Traders now need to watch whether XRP can reclaim the EMA and the $1.26 level on a monthly closing basis. A failed reclaim would strengthen the bearish case, while a sustained recovery above $1.26 could weaken it.
Why Is $XRP Price Going Down Right Now?
The decline was not isolated to $XRP. Bitcoin fell about 20% in June and slipped below $59,000, dragging several large-cap crypto assets lower with it.
MicroStrategy's sale of roughly $216 million in Bitcoin also added to market uncertainty. At the same time, CLARITY Act missed its expected early-July vote, with the Senate recess pushing the floor vote toward late July or potentially August.
Spot XRP ETFs also recorded zero net flows on one recent day, the first such occurrence since June 25. However, these products have had only one losing month since launch and now hold close to 1.5% of its total supply.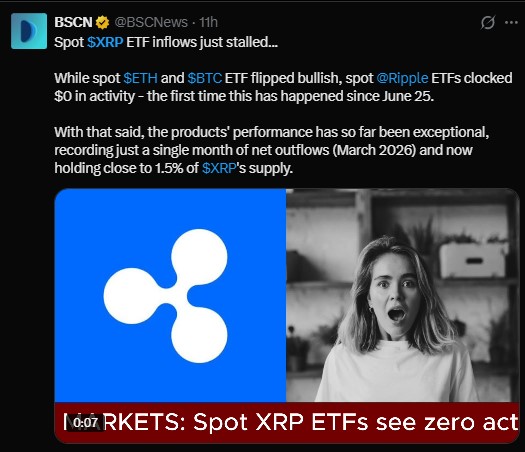
This makes ETF demand an important part of the current analysis today. A return to sustained positive inflows could support the bull case, while persistent outflows would add pressure to an already weak technical structure.
Is the $XRP Ledger Upgrade Finished Yet?
Not fully, but it is getting closer. The XRP Ledger's v3.2.0 software has passed a key milestone, with more than 55% of trusted validators running the latest version.
Validators are particularly important because the network requires sustained support from more than 80% of trusted validators for two straight weeks before the upgrade can fully activate.
The update brings infrastructure improvements, security fixes, and developer-focused changes. While it is unlikely to move the $XRP price immediately, continued progress could strengthen the network's long-term institutional adoption narrative.
What Does $XRP RSI and Moving Averages Say?
The 14-period RSI on the monthly chart sits near 41, below the neutral 50 level. This suggests weakening momentum rather than deeply oversold conditions.
The 50-month simple moving average (SMA) is around $1.14, slightly above the current price. It is trading below both the monthly EMA and SMA remains a warning signal for technical traders.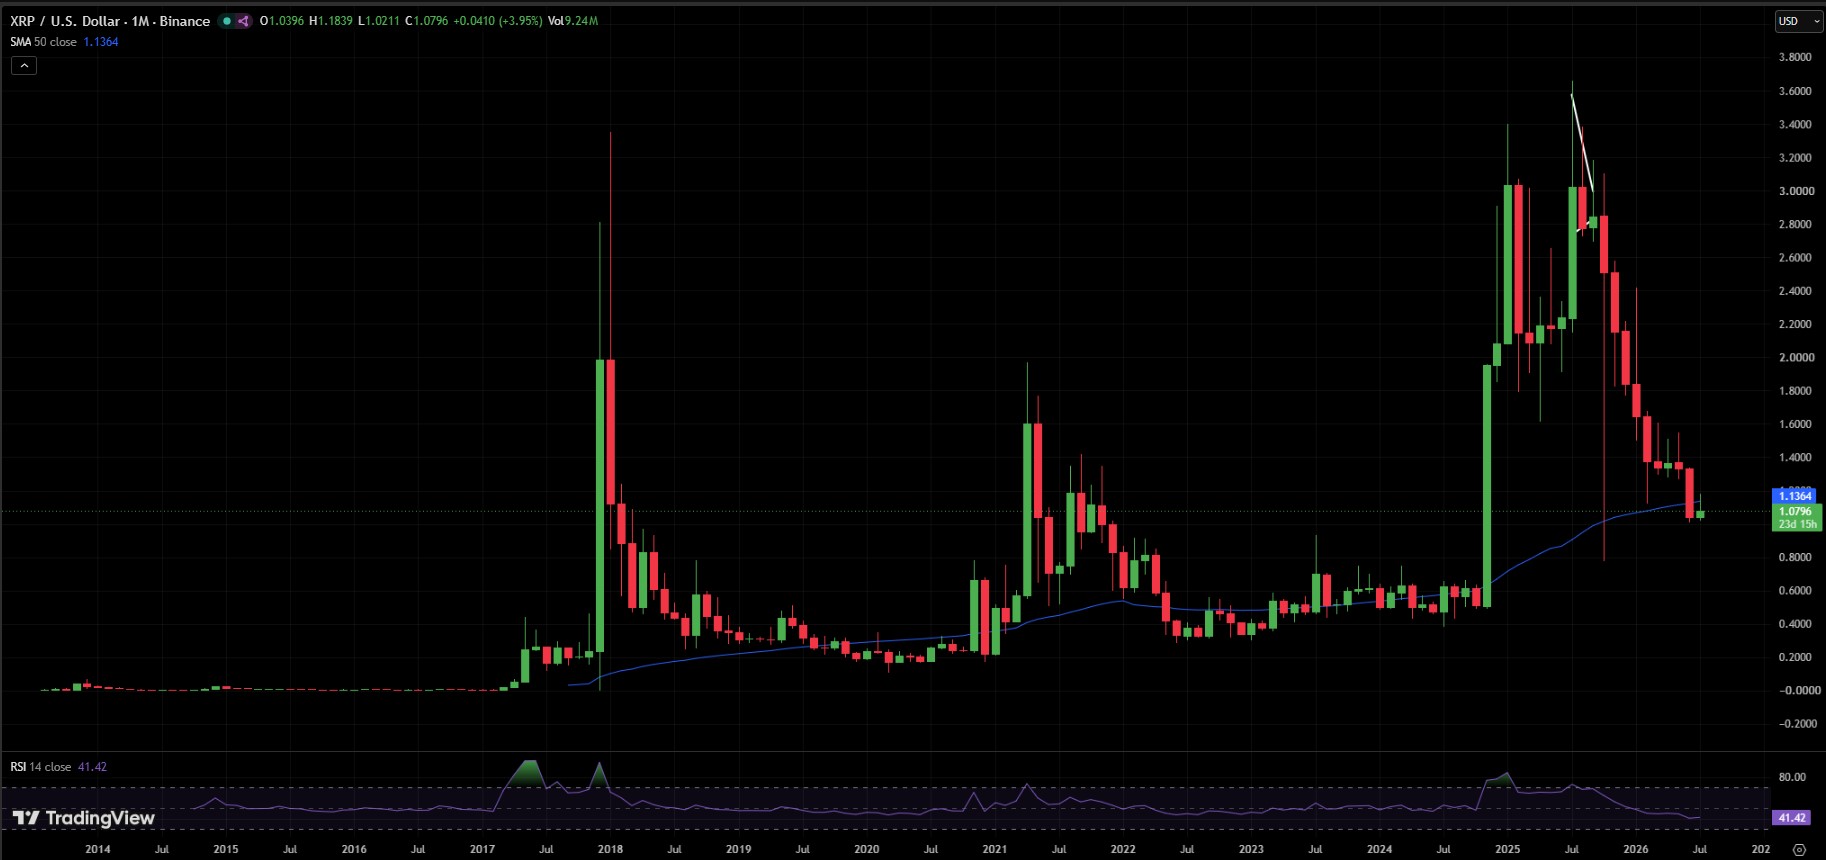
For this XRP forecast, the technical model focuses on four key indicators: RSI for momentum, EMA and SMA levels for trend confirmation, trading volume for breakout strength, and broader ETF flow data for institutional demand. MVRV can provide additional valuation context, but it is not being used as a standalone price-target signal.
The overall setup currently leans cautious. A recovery above $1.14 followed by a monthly close above $1.26 would improve the technical structure and could shift the broader bias toward the bulls.
$XRP Support and Resistance Levels to Watch
| Level | Price | What It Means |
| Resistance | $1.26 | Monthly reclaim needed to improve bullish bias |
| Current Zone | $1.01–$1.08 | Immediate consolidation range |
| Support 1 | $0.93–$0.76 | Major historical support zone below $1.00 |
| Support 2 | $0.67 | Previous resistance area |
| Support 3 | $0.47 | Deeper technical support |
| Support 4 | $0.29 | Extreme bear-case level |
The $1.00 psychological level remains critical. A sustained break below it could expose the $0.93–$0.76 zone. Readers tracking XRP support and resistance levels should focus on monthly closes rather than intraday wicks. A temporary move below support is less significant than a confirmed monthly breakdown accompanied by rising trading volume.
$XRP 50-Month EMA Breakout: What Happens Next?
The current setup can be divided into three scenarios. These are scenario estimates rather than statistical guarantees and depend on how XRP behaves around the key monthly levels.
| Scenario | Target | Probability | Key Assumption | Invalidation |
| Bear Case | $0.47–$0.76 | 30% | EMA breakdown confirms and BTC remains weak | Monthly close above $1.26 |
| Base Case | $0.93–$1.58 | 50% | It stabilizes and ETF demand improves | Sustained break below $0.76 |
| Bull Case | $1.58–$2.80 | 20% | CLARITY progress, ETF inflows and BTC recovery | Monthly weakness below $1.00 |
The most important invalidation point for the current bearish thesis is a sustained monthly close back above $1.26. Such a move would indicate that the loss of the 50-month EMA may have been temporary rather than the beginning of a confirmed long-term breakdown.
$XRP Price Prediction 2026: Where Could XRP Go?
Every XRP price prediction for 2026 currently starts with the same technical question: can it reclaim the $1.26 resistance level on a monthly-closing basis?
If the token remains below that level, the bearish structure stays active. A move toward $0.93–$0.76 becomes increasingly possible, especially if Bitcoin weakens further or ETF flows turn negative.
On the other hand, a monthly-close above $1.26 would represent a meaningful technical improvement. If that breakout comes with rising trading volume and stronger ETF inflows, it could target $1.58 first, followed by $1.98 and potentially $2.80.
Standard Chartered's Geoffrey Kendrick has previously cited a $2.80 base case and an $8.00 bull target, dependent on regulatory progress and substantial ETF inflows. Other bullish market analysts, including EGRAG, have published significantly higher long-term cycle targets in the $7–$10 range. These forecasts show how widely price targets can differ depending on assumptions about regulation, ETF demand, liquidity, and the broader crypto cycle.
For traders asking will it go up tomorrow, short-term price action may remain volatile and difficult to predict. For investors asking is $XRP a good buy right now, the answer depends heavily on risk tolerance and whether they are comfortable with the possibility of further downside below the $1.00 psychological level.
The bigger question is whether it is currently bullish or bearish. Based on the monthly-chart, the bias remains cautious to bearish until the token can reclaim $1.26 and establish that level as support.
For now, the $XRP 50-month EMA breakout remains a developing technical event rather than a confirmed long-term breakdown. The monthly-closing price is the key confirmation signal. A sustained recovery above $1.26 could shift momentum back toward the bulls, while continued weakness below $1.00 would keep deeper support zones in focus.
The most important levels to monitor are $1.26 on the upside and $0.93–$0.76 on the downside. Until one of those zones decisively breaks, it may remain trapped between recovery hopes and broader bearish pressure.
Disclaimer: This article is for informational purposes only and does not constitute financial, investment, or trading advice. Cryptocurrency prices are highly volatile and unpredictable. Always conduct independent research and consult a qualified financial advisor before making investment decisions.











.webp)





