Treasury Yields Surge: 30-Year Rates Near 5.7% as Markets Brace

Treasury Yields Surge: Why Could 5.7% Rates Shake Markets Now?
When Treasury Yields Surge, the effects reach far beyond Wall Street. They can touch home loans, car loans, and even the crypto market.
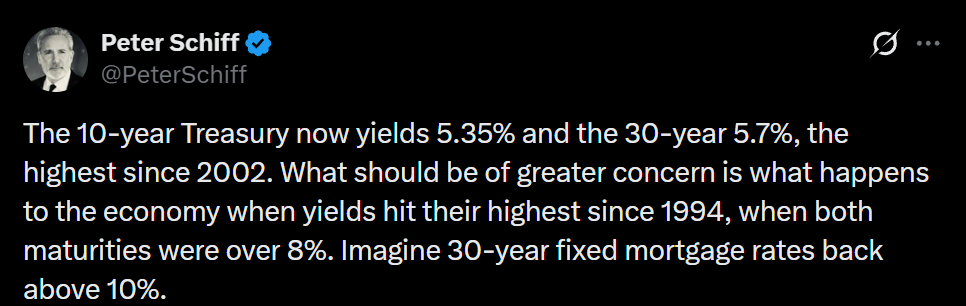
In a post on X, Peter Schiff said the 10-year bond now pays 5.35% and the 30-year bond 5.7%, which he called the highest since 2002.
In this crypto news today update, we check those numbers against official data, explain what they mean in simple words, and keep facts apart from opinion.
What Is Being Said
Think of a government bond as an IOU. You lend money to the U.S. government, and it pays you interest for waiting. That interest is the bond rate, and when lenders demand more for their money, it climbs.
Schiff's bigger worry is a return to 1994, when he says both bonds paid above 8%. He asks readers to imagine 30-year fixed mortgage rates back above 10%. That is his picture of a worst case, not a forecast.
His "highest since 2002" claim holds up. CNBC reported on October 5 that the 10-year briefly touched 5.349%, its highest level since April 2002.
The 30-year period reached 5.703%, a level not seen since late May 2002. Schiff's figures closely match these brief peaks rather than the closing numbers.
What the Official Numbers Show
The U.S. Department of the Treasury publishes a daily rate table. It is built from bid prices collected around 3:30 PM each trading day, as explained in its methodology page.
The same data series is also available through the Federal Reserve's H.15 release and FRED for the 10-year and 30-year periods. Here are the latest three days:
| Date | 10 year | 20 year | 30 year |
| Oct 1, 2026 | 5.24% | 5.64% | 5.61% |
| Oct 2, 2026 | 5.28% | 5.67% | 5.63% |
| Oct 5, 2026 | 5.31% | 5.70% | 5.66% |
The pattern is clear:
-
Every maturity in the table rose on each of the three days.
-
The 10 year move is up 0.07 points, from 5.24% to 5.31%.
-
The 30 year move is up 0.05 points, from 5.61% to 5.66%.
Schiff's figures of 5.35% and 5.7% are slightly higher than the table because the table is a 3:30 PM snapshot, while his numbers match the day's highs. The move also came despite a weak September jobs report on Friday.
That report eased worries about another Fed rate hike in October, and CNBC noted that traders priced in roughly an 82% chance that the Fed holds rates steady. Even so, long-term bond rates kept climbing.
Why It Reaches Your Wallet
Whenever Treasury yields surge, borrowing gets more expensive across the economy.
Long-term bond rates act like a guide, and many other loans tend to move in the same direction.
In simple words:
-
Home loans: mortgage rates often follow long-term bond rates up or down.
-
Car and business loans: lenders usually price these with the same pressure in mind.
-
Government borrowing: the government itself pays more to borrow when rates rise.
That is why a number on a bond screen can end up changing a family's monthly payment.
Why 1994 Keeps Coming Up
Schiff compares today with 1994 because rates were far higher then, at over 8% for both bonds.
By the official Oct 5 table, the 10-year is still about 2.7 points below 8%, and the 30-year is about 2.3 points below. So the gap is large, and the comparison is a warning, not a match.
One more point on accuracy. The "highest since 2002" and "above 8% in 1994" claims come from the post itself.
The daily table above only shows recent days, so it cannot confirm them. Readers who want to check can use Treasury's archive of older rates.
What It Could Mean for Crypto
Crypto does not pay interest, while government bonds do. When safe bonds pay more, some investors prefer them over riskier assets, and that can add pressure on crypto.
This is a general market idea, not a promise. Crypto also moves on its own news, and the sources here contain no crypto price data, so check live charts before drawing conclusions.
When Treasury Yields Surge, Here Is What to Watch Next:
-
The next daily rate table to see if the 30-year holds near 5.7%.
-
Whether the rise slows down or keeps going for another week.
-
News on mortgage and loan costs.
-
How crypto trades on the days when bond rates jump.
Conclusion
Official data confirms that long-term bond rates rose on each of the last three days. Bigger claims, like "highest since 2002" or a return to 1994 levels, need a closer check against older records.
For now, the smart move is to watch the data, not the headlines.
Disclaimer
This article is for educational and informational purposes only and is not financial or investment advice. Crypto assets are high risk, their prices can be very volatile, and you can lose some or all of your money. Always do your own research and consider speaking with a licensed financial advisor before making investment decisions.









