AAVE Price Prediction: Will the $103.28 Support Hold This Week?

Will buyers defend the $103.28 support level this week or slide towards the $85.85 level next?
This AAVE price prediction begins with AAVE trading under its broken range while traders scan the latest crypto news for a catalyst. That range was a band held between a support level, where buyers step in, and a resistance level, where sellers cap rallies.
AAVE Price Forecast: 24-Hour Snapshot
AAVE ranks 50th by market cap per CoinGecko market data. FDV, or fully diluted valuation, is the value if every token existed today. FDV tops market cap by only $62M.
Metric | Value |
Price | $111.28 |
7-day change | -14.4% |
24h range | $109.54 to $117.28 |
Market cap | $1.716B |
Market cap rank | 50th |
FDV | $1.778B |
24h volume | $221.14M |
Total value locked (TVL) | $15.512B |
Circulating supply | 15.441M |
Max supply | 16M |
Source: CoinGecko, captured Nov 13, 2026, 07:18 UTC
Daily volume equals about 12.9% of market cap. High turnover during a 7-day slide can mean sellers are still pressing, which shapes this AAVE price prediction around support.
AAVE V4 News: $25M Base Deposits and Loan Swaps
A stock-backed loan is secured by stock holdings. Per the official Aave X post, Aave V4's market for these loans on Base hit $25M in deposits.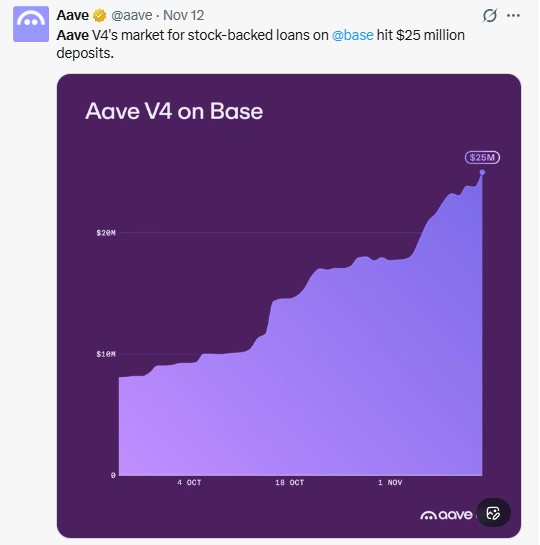
Source: Aave official X post, captured Nov 13, 2026, 07:18 UTC
Loan swaps are also live for Aave V4 markets on Ethereum, Base, and Avalanche, per the Aave X announcement. A swap moves a loan from one asset to another without exiting the position.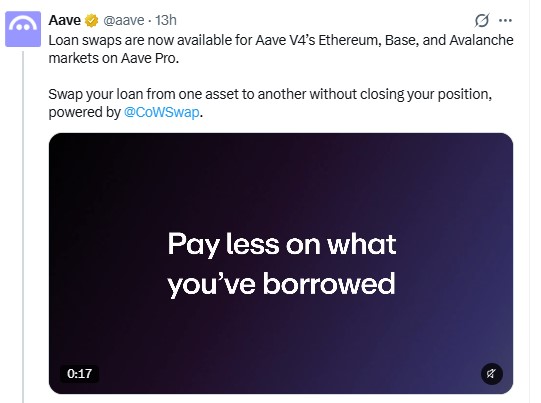
Source: Aave official X post, captured Nov 13, 2026, 07:18 UTC
Both posts are no more than a day or two old, yet AAVE still trades 14.4% lower on the week. TVL, or total value locked, sits at $15.512B, and earlier AAVE Monad TVL news covered that metric. If Base deposits keep growing, the AAVE V4 news could support the price; if growth stalls, it adds little.
AAVE Price Forecast Risk: Top 100 Holders Control 77.72%
Per Etherscan holder data, the top 100 holders control 77.72% of supply. The top 10 hold 43.50%.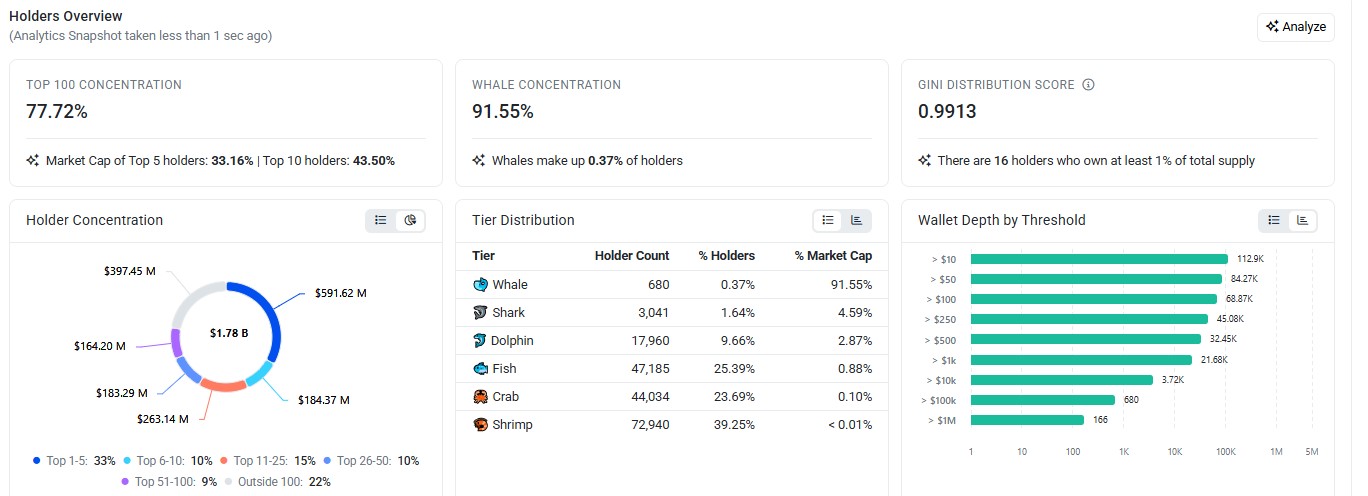
Source: Etherscan, AAVE holders overview, captured Nov 13, 2026, 07:18 UTC
Whales, meaning the largest wallets, hold 91.55% of market cap across 680 wallets. Sixteen holders own at least 1% of total supply. A single large sale from wallets this concentrated can push the price through a support level fast.
AAVE Liquidation Data: Longs Take 98% of $3.00M Wipeout
Longs got hit hard. A liquidation is a forced exit from a leveraged trade when margin runs out. AAVE liquidations reached $3.00M in 24 hours per CoinGlass liquidation data.
Window | Total | Longs | Shorts |
1h | $46.78K | $43.86K | $2.92K |
4h | $1.85M | $1.84M | $10.40K |
12h | $1.94M | $1.91M | $33.54K |
24h | $3.00M | $2.96M | $45.30K |
Source: CoinGlass, captured Nov 13, 2026, 07:18 UTC
The 4-hour window impacts most, with longs losing $1.84M against $10.40K for shorts. Forced long selling adds sell orders into a falling market, which keeps pressure on every support level.
AAVE Open Interest and Futures Volume Data
Open interest is the total value of futures positions still open. Futures volume reached $380.13M over the last day per CoinGlass futures data, led by Binance at $130.48M. BingX ranks second, $63.87M behind.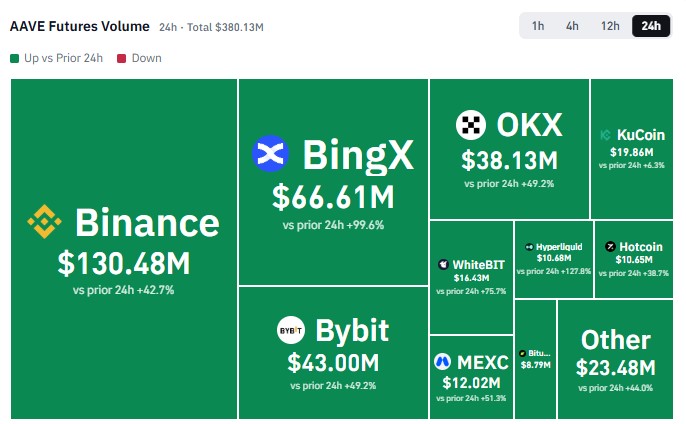
Source: CoinGlass, AAVE futures volume, captured Nov 13, 2026, 07:18 UTC
Open interest totals $279.46M, with Binance at $54.15M just $2.04M ahead of Gate. Most venues show falling positions, with Gate down 8.6%. MEXC, where open interest rose 15.9%.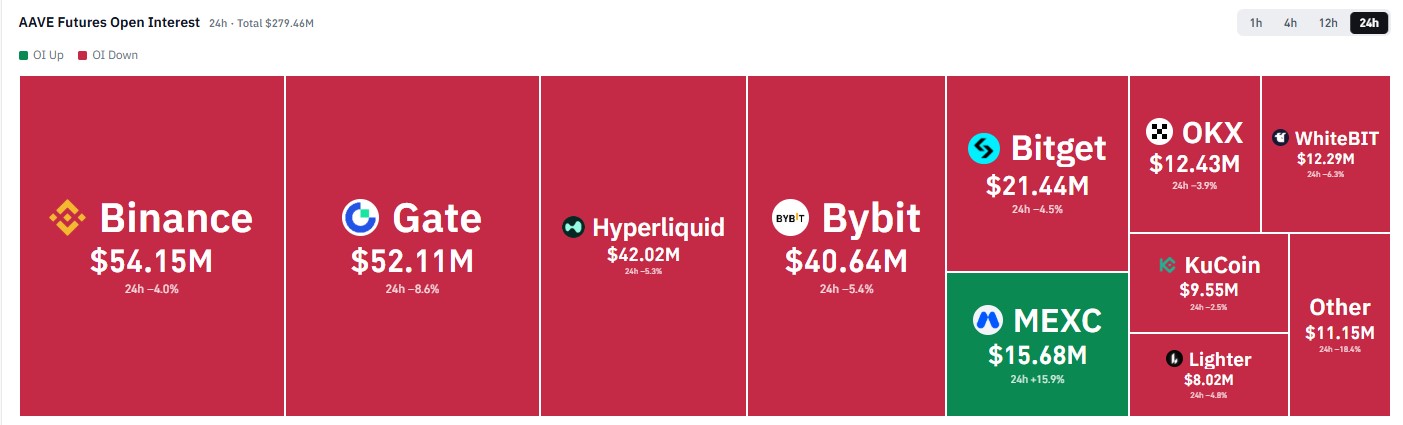
Source: CoinGlass, AAVE futures open interest, captured Nov 13, 2026, 07:18 UTC
Falling open interest reads bearish; it cuts both ways, since exiting positions also means fewer forced sellers later.
AAVE Technical Analysis: 50-Day EMA and RSI Levels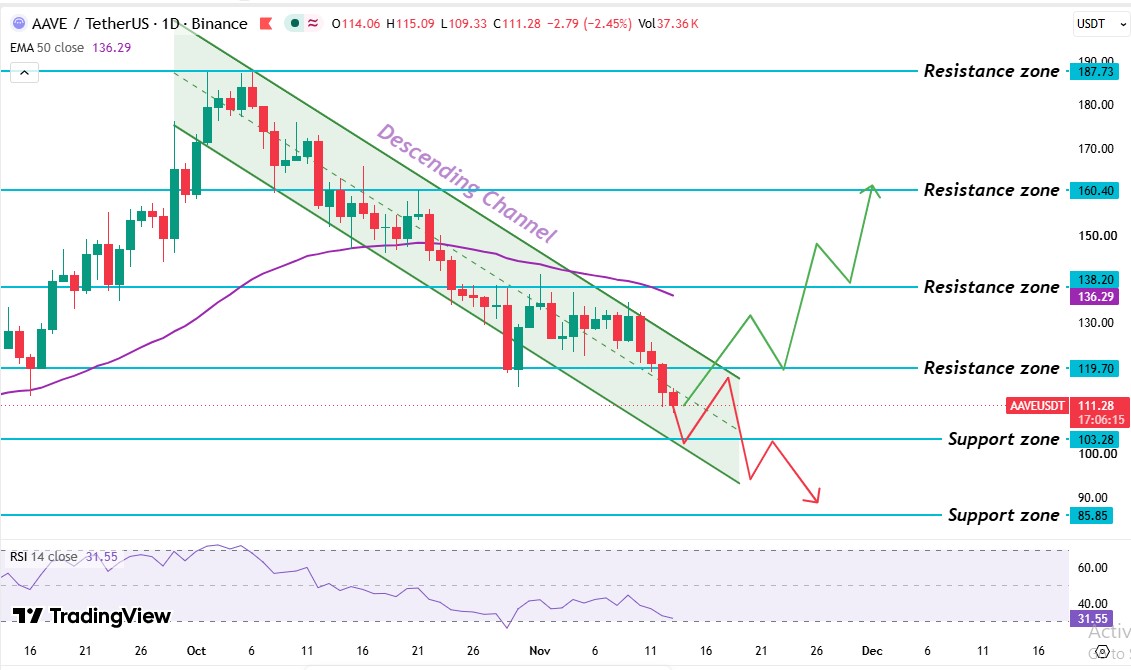
Source: TradingView, AAVE/USDT 1D chart with EMA 50 and RSI 14, captured Nov 13, 2026, 07:18 UTC
The Binance daily chart for AAVE/USDT on TradingView frames this AAVE price prediction. A rally into early October pushed AAVE up to the $187.73 resistance level before sellers took control.
Sellers rejected AAVE twice near the $187.73 resistance level, then pushed it down a descending channel, with two falling lines boxing in lower highs and lower lows. A bounce toward the $160.40 resistance level stalled in mid-October. Traders can compare the earlier AAVE wedge setup with this channel.
A tight band under the $138.20 resistance level followed. Then a daily candle trading below the $119.70 level, which buyers defended in late October.
Right now, AAVE trades under the broken $119.70 resistance level and the 50 EMA level and above the $103.28 support level.
The AAVE 50-day EMA sits at $136.29. AAVE's $111.28 price trades $25.14 below it, and the latest candle trades under it too, and the broken $119.70 level comes first, so a real recovery needs a daily candle trading above both levels.
The AAVE RSI reads 31.55 on the 14-day setting; it peaked near 70 in early October. Under 50 means sellers hold the edge. Above 30 means oversold conditions, where selling has gone too far and hasn't formed, so the price has room to fall.
AAVE Support and Resistance Levels
Level | Type |
$187.73 | Resistance level |
$160.40 | Resistance level |
$138.20 | Resistance level |
$136.29 | 50-day EMA |
$119.70 | Resistance level |
$103.28 | Support level |
$85.85 | Support level |
A resistance level is where sellers have capped rallies, and a support level is where buyers need to step in. The nearest pair is $119.70 above and $103.28 below.
AAVE Price Forecast: Bull, Base, and Bear Scenarios
Scenario | Trigger | Target | Invalidation |
Bull | Daily candle trades above $119.70 | $136.29, then $160.40 | Daily candle back below $119.70. |
Base | Price holds between $103.28 and $119.70. | Sideways trade in that range | Daily candle breaks either level. |
Bear | Daily candle trades below $103.28 | $85.85 | Daily candle trades above $119.70 |
The main risks are a stall in V4 deposit growth and a technical invalidation. A daily candle above $119.70 would cancel the bearish case.
AAVE Price Prediction: Expert Outlook
According to CoinGabbar analysis, this AAVE price prediction stays bearish while the price trades under $119.70. The RSI at 31.55 shows sellers in control, and longs took 98% of recent liquidations.
But V4 deposit growth to $25M gives dip buyers a reason to defend $103.28. Traders should watch for a daily candle above $119.70, since that move would put the 50-day EMA back in play.
Disclaimer: This article is for information only and isn't financial advice. Traders should do their own research and risk only what they can afford to lose.