Aster Price Prediction: Liquidation Data Hits $9.08M in 24 Hours


Did the crash already set the bottom for ASTER, or is another leg down coming?
This Aster price prediction begins with ASTER trading under its broken October range, which an earlier support level update had flagged before sellers took control. Leveraged longs got swept in one sharp move, and the rebound now faces a stack of overhead resistance levels.
Aster Price Forecast: 24-Hour Market Snapshot
CoinGecko market data ranks ASTER 56th with a $1.399B market cap. FDV, or fully diluted valuation, is the project's value if every planned token were already trading.
Metric | Value |
Price | $0.5450 |
24h change | +3.9% |
Market cap | $1.399B |
Market cap rank | 56th |
Fully diluted valuation (FDV) | $4.237B |
24h trading volume | $361.136M |
Circulating supply | 2.572B ASTER |
Total supply | 7.787B ASTER |
Max supply | 8B ASTER |
Source: CoinGecko, ASTER market snapshot, captured Nov 16, 2026, 04:17 UTC
Price trades in the lower quarter of the 24h range. Only 2.572B of the 8B max supply circulates, and new supply could weigh on any rally.
Aster News: Team Blames Leveraged Liquidations
Liquidation means a leveraged trade gets ended by force once the trader's margin runs out. Per the Leonard Aster X post, the team says the swing came from liquidations of highly leveraged positions, likely malicious.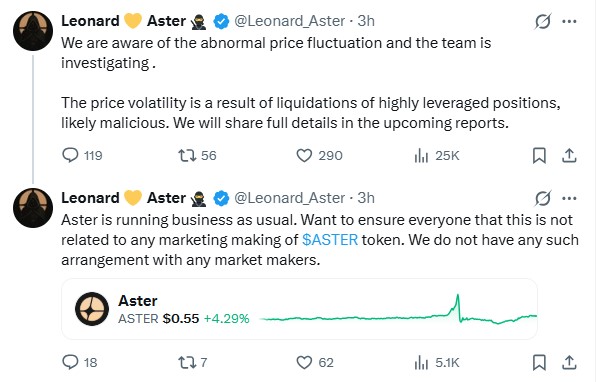
Source: X post by @Leonard_Aster, captured Nov 16, 2026, 04:17 UTC
The same post says Aster is running business as usual and has no arrangement with any market makers. This Aster news is only hours old, and the full details haven't been shared yet.
If the report confirms a targeted attack, traders following latest crypto news will expect buyers to defend the $0.4872 support level. A vague or delayed report keeps the sell-off open to a retest.
Aster Whale Concentration: Top 10 Holders Own 94.01%
BscScan holder data shows the top 100 wallets hold 98.13% of supply, and the top 10 alone account for 94.01%.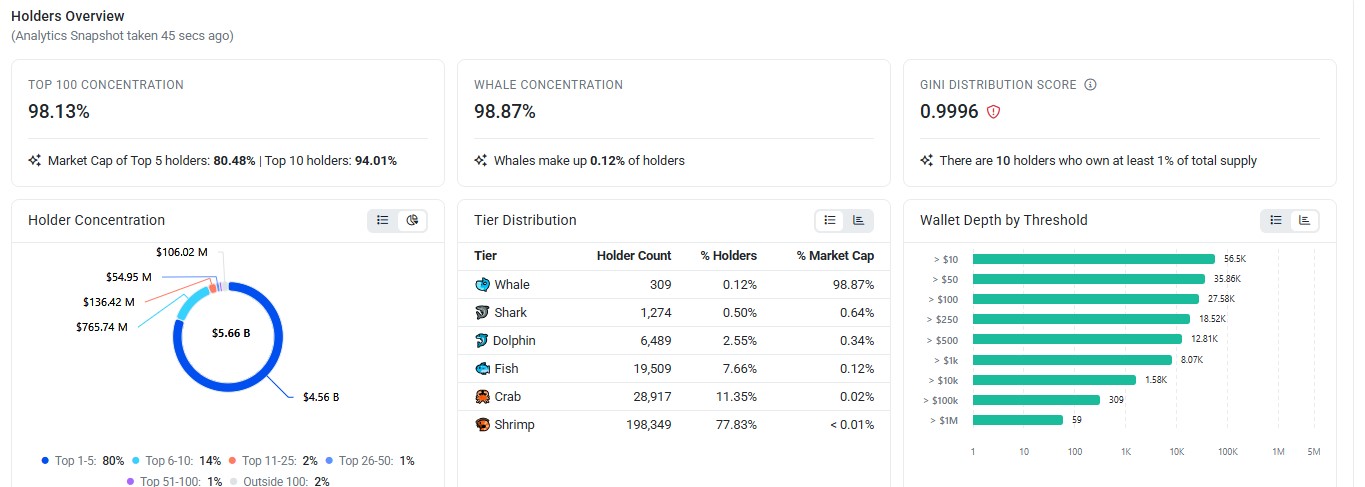
Source: BscScan, ASTER holders overview, captured Nov 16, 2026, 04:17 UTC
Whales, the largest wallet tier, number 309, are just 0.12% of holders. Yet they hold 98.87% of the market cap, and ten holders each own at least 1% of supply.
That whale concentration adds risk to any Aster price prediction, because one large sale can move the price fast. The Gini score, a gauge of how unequal ownership is, reads 0.9996 against a maximum of 1.
Aster Liquidation Data: $9.08M Wiped Out in 24 Hours
Window | Total liquidations | Longs | Shorts |
1h | $23.06K | $13.39K | $9.67K |
4h | $379.94K | $215.54K | $164.40K |
12h | $8.93M | $5.86M | $3.07M |
24h | $9.08M | $5.95M | $3.13M |
Source: CoinGlass, ASTER liquidation data, captured Nov 16, 2026, 04:17 UTC
Liquidations hit ASTER hard. Per CoinGlass liquidation data, traders lost $9.08M over 24 hours. Longs took $5.95M, shorts $3.13M.
The flush came early. Of the $8.93M wiped out in 12 hours, only $379.94K hit in the latest four, so the wave has slowed.
Longs made up 65.5% of the 24h total in the liquidation data, and forced long liquidations add sell orders that deepen a drop.
Aster Open Interest Holds at $333.49M
Open interest is the total value of futures contracts still open. CoinGlass futures data puts the total at $333.49M across exchanges.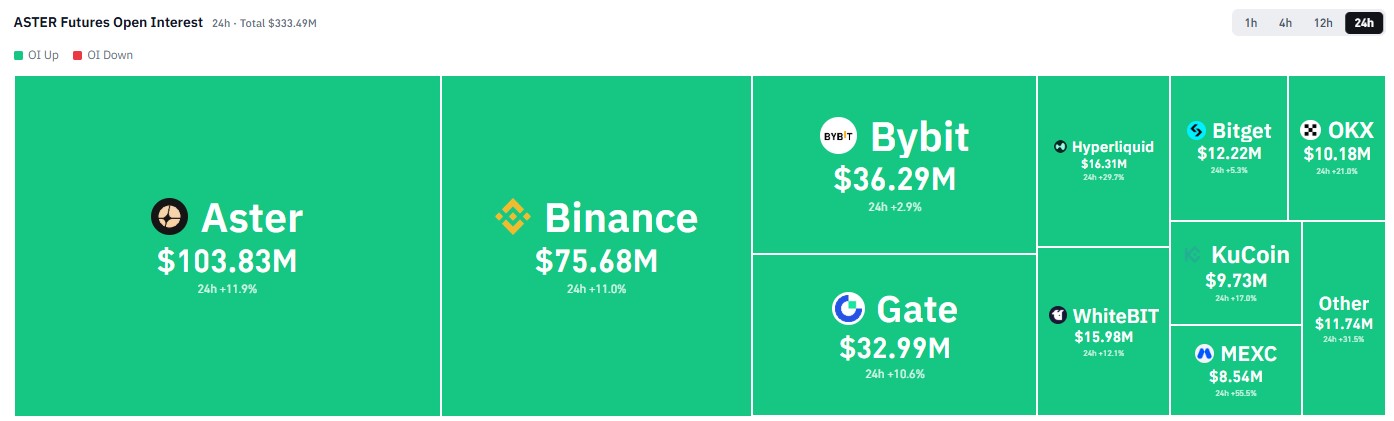
Source: CoinGlass, ASTER futures open interest, captured Nov 16, 2026, 04:17 UTC
Every venue on the heatmap shows open interest up over 24 hours. Futures volume totals $1.32B, and the heatmaps above show each exchange's figures.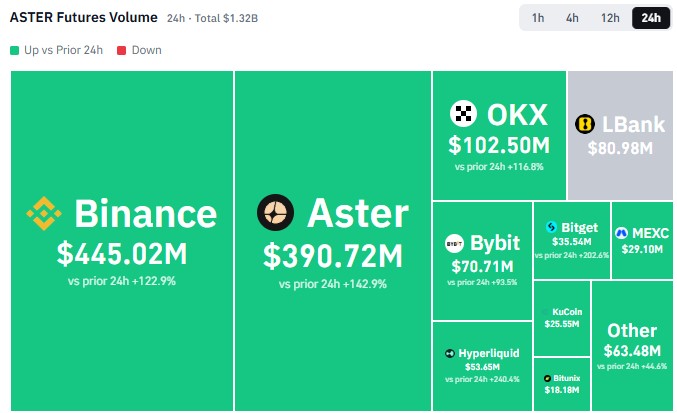
Source: CoinGlass, ASTER futures volume, captured Nov 16, 2026, 04:17 UTC
That's over 3.5 times the $361.136M spot volume. So who is driving the move, spot buyers or leveraged traders?
Rising open interest after a violent swing means traders added positions, and that can feed another liquidation wave if price breaks $0.4872.
Aster Technical Analysis: 50-Day EMA and RSI Levels
The Binance 1D chart for ASTER/USDT on TradingView frames this Aster price prediction. A November drop pushed ASTER down to $0.4872 before buyers took control.
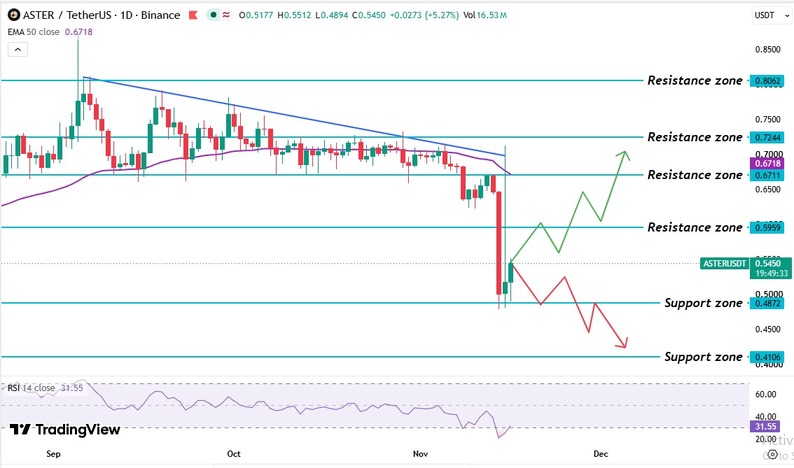
Source: TradingView, ASTER/USDT 1D Binance chart with EMA 50 and RSI 14, captured Nov 16, 2026, 04:17 UTC
ASTER spiked above the $0.8062 resistance level in early September, then settled into a range, a band held between the $0.6711 support level and the $0.7244 resistance level. Buyers tried several times to break $0.7244 and failed, and sellers also defended the upper trendline.
Early November changed that. ASTER broke below $0.6711, and the level flipped roles because a broken support level often turns into a resistance level that sellers defend. Then one vertical sell-off hit the $0.4872 support level, where buyers need to step in.
Traders comparing this chart with the earlier USD1 boost analysis will see the old support levels overhead. Right now, ASTER sits between the $0.4872 support level and the $0.5959 resistance level, under the 50-day EMA.
The ASTER 50-day EMA sits at $0.6718. ASTER's $0.5450 price trades 18.9% below it, and the latest daily candle trades below the line. A real recovery needs a candle trading above the EMA and the broken $0.6711 level.
The ASTER RSI reads 31.55 on the 14-day setting. It dipped near 21 during the crash. The bounce reads like a recovery, but a reading under 50 means sellers hold the edge, and a move above 30 only means oversold conditions have faded.
Aster Support Levels and Resistance Levels
Level | Type |
$0.8062 | Resistance level |
$0.7244 | Resistance level |
$0.6718 | 50-day EMA |
$0.6711 | Resistance level |
$0.5959 | Resistance level |
$0.4872 | Support level |
$0.4106 | Support level |
The nearest support level sits at $0.4872, and the nearest resistance level at $0.5959.
Aster Price Forecast: Bull, Base, and Bear Scenarios
Scenario | Trigger | Target | Invalidation |
Bull | Daily candle trades above $0.5959 | $0.6718 then $0.7244 | Falls back below $0.5959 |
Base | Price holds between $0.4872 and $0.5959. | Sideways trade inside that range | Daily candle breaks either level. |
Bear | Daily candle trades below $0.4872 | $0.4106 support level | Daily candle trades above $0.5959 |
Any Aster price forecast carries two main risks. A delayed team report could keep traders nervous, and a daily candle trading above $0.5959 would cancel the bearish case.
Expert Outlook: Aster Price Prediction
As per CoinGabbar analysis, it keeps the Aster price prediction bearish-leaning while ASTER trades below the 50-day EMA. The RSI at 31.55 shows sellers still hold the edge.
The $0.4872 support level is the one to watch. A daily candle trading below it would show the crash low was only a pause.
Disclaimer: This article is for information only and isn't financial advice. Traders should do their own research and risk only what they can afford to lose.