Audiera Price Prediction November 2026: Will BEAT Hold $0.0815?


Can Audiera hold a 44.1% weekly jump after a 97.39% slide over 90 days?
This Audiera price prediction November 2026 maps BEAT/USDT from Oct 29, 2026, using CoinGecko, CoinGlass, BscScan, and TradingView data. BEAT trades at $0.1004. For the rally backstory, see why Audiera is up today.
Audiera 24-Hour Market Snapshot
CoinGecko market data shows BEAT trading at $0.1004 as of Oct 29, 2026, 11:30.
Metric | Value |
Price | $0.1004 |
24h range | $0.07849 to $0.1033 |
Market cap | $35.455M |
FDV | $100.436M |
24h volume | $9.334M |
Circulating supply | 353.017M of 1B |
Source: CoinGecko, captured Oct 29, 2026, 11:30
Audiera Price Performance and Range
CoinGlass price performance data, captured Oct 29, 2026, 11:30 UTC, shows $BEAT up 26.70% in 24 hours.
The 30-day gain is 11.12%. But the 90-day loss is 97.39%, and year-to-date $BEAT is down 93.17%.
CoinGecko's 24h range at 11:30 UTC runs from $0.07849 to $0.1033. Price sits 27.9% above the low and 2.8% below the high. Through September and October, the prior range held BEAT between $0.0652 and $0.1173.
Audiera Holder Concentration and Whale Wallets
The holder concentration dashboard, captured Oct 29, 2026, 11:30 UTC, shows the top 100 wallets holding 99.38% of supply. Whale wallets, meaning very large holders, number 70 and own 99.18%.
Per the BscScan holder list at 11:30 UTC, the largest wallet holds 30.8333% of the supply. The next wallet holds 10.7917%. Gate, an exchange, sits fourth at 7.8724%, and the top 10 hold 85.37%.
Fourteen holders own at least 1% each. That's thin ownership, so one large sale can move the price.
Audiera Liquidation Data Shows Shorts Hit First
Shorts took the hit. CoinGlass liquidation data, captured Oct 29, 2026, 11:30 UTC, shows $104.95K liquidated in 24h. Shorts lost $63.83K, and longs $41.13K.
Over the last 4h, shorts lost $37.45K against $6.55K for longs. In the last hour, shorts lost $14.68K and longs $5.55K.
Audiera Futures Volume and Open Interest
Open interest is the total value of futures contracts still open. CoinGecko lists $60.348M for BEAT perps at 11:30 UTC on Oct 29, 2026.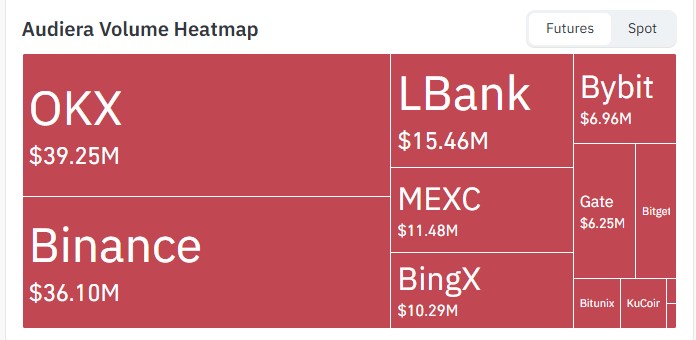
Source: CoinGlass volume heatmap, captured Oct 29, 2026, 11:30 UTC.
The CoinGlass futures volume heatmap, captured at 11:30 UTC, ranks OKX first at $39.25M. Binance follows at $36.10M, a $3.15M gap. LBank is third at $15.46M, with MEXC fourth at $11.48M.
Audiera Technical Forecast: 1-Day Chart Analysis
this Audiera price prediction November 2026. In August, $BEAT fell from above the $0.1919 level.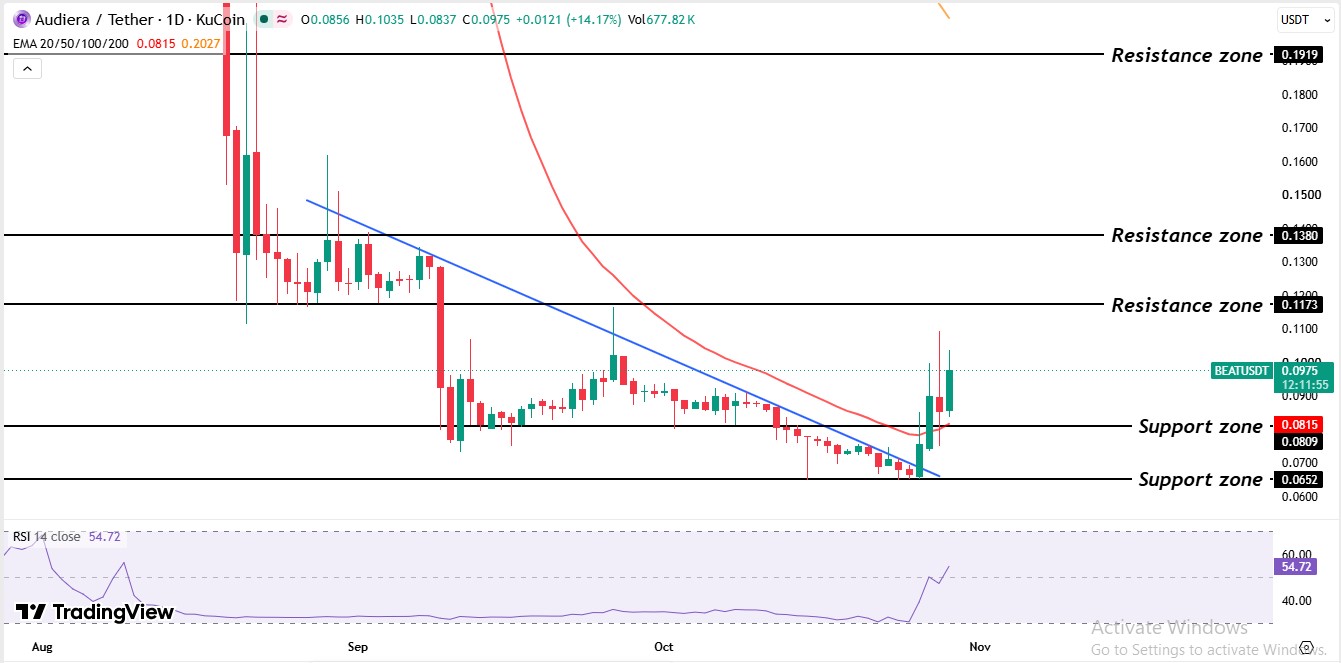
Source: TradingView, KuCoin $BEAT/USDT 1D, captured Oct 29, 2026, 11:30 UTC.
The price started forming lower highs and lower lows and then formed a descending trendline. $BEAT ranged below $0.1173 in September and traded above that level in the entirety of September, and in October the price broke that $0.1173 level and fell to the $0.0652 level, where buyers tend to step in. The last BEAT support test covers that drop.
But sellers lost control in late October. $BEAT broke above the trendline, and then the price also broke the 20-day EMA resistance.
The 20-day EMA sits at $0.0815 and now acts as support, which favors buyers. And the 50-day EMA at $0.2027 still sits overhead, so rallies face sellers. RSI is currently at 54.72.
Audiera Support and Resistance Levels
Level | Type |
$0.1919 | Resistance |
$0.1380 | Resistance |
$0.1173 | Resistance |
$0.0815 | Support |
$0.0652 | Support |
Levels come from the TradingView chart at 11:30 The nearest are $0.0815 below and $0.1173 above.
Audiera Bull, Base, and Bear Scenarios
Scenario | Trigger | Target | Invalidation |
Bull | Daily candle trades above $0.1173 | $0.1380 | Trades below $0.0815 |
Base | Holds between levels | $0.0815 to $0.1173 | Breaks either level |
Bear | Daily candle trades below $0.0815 | $0.0652 | Trades above $0.1173 |
In this Audiera price prediction November 2026, the bull needs buyers to clear $0.1173 on rising volume. Bear needs a break of $0.0815.
Technical invalidation comes first, since a daily candle trading below $0.0815 voids the bullish setup. Holder concentration adds a second risk, because one wallet holds 30.8333% of the supply.
Audiera price prediction November 2026: Expert Outlook
The evidence favors a range over a trend. Open interest is 170.2% of market cap, and the top 100 wallets hold 99.38% of supply. That outweighs a 26.70% daily gain. This Audiera price prediction November 2026 keeps BEAT between $0.0815 and $0.1173 until trading volume proves the rally.
Monitor the 20-day EMA at $0.0815. A daily candle trading below it erases the breakout and puts $0.0652 in play.
Disclaimer: This article is for information only and isn't financial advice. Traders should do their own research and risk only what they can afford to lose.